- Home
- /
- Programming
- /
- SAS Procedures
- /
- Re: Help on linear-plateau regression model
- RSS Feed
- Mark Topic as New
- Mark Topic as Read
- Float this Topic for Current User
- Bookmark
- Subscribe
- Mute
- Printer Friendly Page

- Mark as New
- Bookmark
- Subscribe
- Mute
- RSS Feed
- Permalink
- Report Inappropriate Content
we want to use this model to calculate the X threshold where Y begin to decline, with conidence interval.
The attached is out data.
who has the procedure? could ou send me a copy? thanks a lot.

- Mark as New
- Bookmark
- Subscribe
- Mute
- RSS Feed
- Permalink
- Report Inappropriate Content
Carefully look at the documentation for PROC NLIN, especially Example 63.1 Segmented model. This fits a quadratic up to an unknown join point, followed by a plateau.
title 'Quadratic Model with Plateau';
proc nlin data=a;
parms alpha=.45 beta=.05 gamma=-.0025;
x0 = -.5*beta / gamma;
if (x < x0) then
mean = alpha + beta*x + gamma*x*x;
else mean = alpha + beta*x0 + gamma*x0*x0;
model y = mean;
if _obs_=1 and _iter_ =. then do;
plateau =alpha + beta*x0 + gamma*x0*x0;
put / x0= plateau= ;
end;
output out=b predicted=yp;
run;
I hope this gets you started on what you wish to do.
Steve Denham
- Mark as New
- Bookmark
- Subscribe
- Mute
- RSS Feed
- Permalink
- Report Inappropriate Content
Thanks so much Steve, and also, does below procedure can also be used for our data? what the difference between this 2 procedures?
DATA a;
INPUT met gain @@;
DATALINES;
80 102 85 115 90 125 95 133 100 140
105 141 110 142 115 140 120 142
;
PROC NLIN;
PARMS a = 102 b = 2.7 c = -0.04;
x = met-80;
x0 = -.5*b / c;
IF x < x0 THEN
MODEL gain = a+b*x+c*x*x;
ELSE
MODEL gain = a+b*x0+c*x0*x0;
IF _obs_=1 and _iter_ =. THEN DO;
plateau = a+b*x0+c*x0*x0;
x0 = x0+80;
PUT / x0 = plateau= ;
END;
RUN;
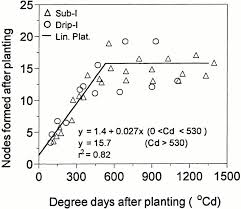
and another question is, how to make a graph like below, thanks a lot.
.jpg")
Catch up on SAS Innovate 2026
Nearly 200 sessions are now available on demand with the SAS Innovate Digital Pass.
Explore Now →Learn the difference between classical and Bayesian statistical approaches and see a few PROC examples to perform Bayesian analysis in this video.

Find more tutorials on the SAS Users YouTube channel.
SAS Training: Just a Click Away
Ready to level-up your skills? Choose your own adventure.
-
2 replies
-
06-26-2013 09:24 PM
-
4686 views
-
0 likes
-
2 in conversation
-
