- Home
- /
- Analytics
- /
- Forecasting
- /
- Re: Trend function in SAS
- RSS Feed
- Mark Topic as New
- Mark Topic as Read
- Float this Topic for Current User
- Bookmark
- Subscribe
- Mute
- Printer Friendly Page

- Mark as New
- Bookmark
- Subscribe
- Mute
- RSS Feed
- Permalink
- Report Inappropriate Content
Hello all,
I have the following problem (SAS 9.1.3 user):
I have a table containing values like this:
01/2013 2.200.225 units
02/2013 2.250.000 units
03/2013 2.376.999 units
.... ....
02/2014 3.000.100 units
I am looking for a sas function that generates a trend/forecast for these values (for e.g.: 12/2014 trend: 3.255.000). While searching the web I found a function called "proc timeseries", but unfortunately this function is not available in SAS 9.1.3.
Does anyone know a function or solution for my problem?
Thanks in advance and best regards
Cristobal
Accepted Solutions

- Mark as New
- Bookmark
- Subscribe
- Mute
- RSS Feed
- Permalink
- Report Inappropriate Content
I'm not a SAS GRAPH expert, but I do have EG so it generated this code for me when I plotted 4 different variables on the same vertical axis. It looks like you were using 2 axes, but you should still be able to adapt this and use the asterisk for the multiple series on one of the vertical axes:
PROC GPLOT DATA = WORK.SORTTempTableSorted
96 ;
97 PLOT de2_clips * date manual_clip_effort * date autokey_effort * date manual_fullpage_effort * date /
98 OVERLAY
99 VAXIS=AXIS1
100
101 HAXIS=AXIS2
102
103 FRAME LEGEND=LEGEND1
104 ;
105 /* -------------------------------------------------------------------
106 End of task code.
107 ------------------------------------------------------------------- */
108 RUN;

- Mark as New
- Bookmark
- Subscribe
- Mute
- RSS Feed
- Permalink
- Report Inappropriate Content
A linear regression would give you the answer based on a linear trendline..
Proc reg data=have;
model units = date;
run;
This will give you gradient and intercept coefficients that you can apply to the date (in sas date form) to give you a linear estimate.
This code and be emended to include polynomial trend-line fitting as shown to account for higher order relationships:
Proc reg data=have;
model units = date date*date;
run;
- Mark as New
- Bookmark
- Subscribe
- Mute
- RSS Feed
- Permalink
- Report Inappropriate Content
Hello,
thanks for your replay. Unfortunately the reg procedure cannot be found. I get the message "ERROR: Procedure reg not found".
It seems, that this procedure is not available in SAS9.1.3?
Best regards

- Mark as New
- Bookmark
- Subscribe
- Mute
- RSS Feed
- Permalink
- Report Inappropriate Content
Do you have SAS/STAT installed? You can run PROC SETINIT to see what modules are installed.
It is an unusual installation to have SAS/ETS and not SAS/STAT, but that is possible. You can use PROC MODEL as a way to do simple regression if only SAS/ETS is installed.
Steve Denham
- Mark as New
- Bookmark
- Subscribe
- Mute
- RSS Feed
- Permalink
- Report Inappropriate Content
Lag the units, calculate % change, take average (crude way but I know it would work with Base SAS and any version):
01/2013 2.200.225 units .
02/2013 2.250.000 units 2.200.225 0.2%
03/2013 2.376.999 units 2.250.000 5.6%
.... ....
02/2014 3.000.100 units
So the trend after the first 3 months would be 2.9%.
Then put the average of pctchange (ie trend) into a macro variable and bring it back into the data set to do forecast:
proc sql;
select mean(PctChange) into :Trend from...;
quit;
Data Forecast;
set ...;
PredictedUnits = LagUnits * (1+&Trend);
run;
- Mark as New
- Bookmark
- Subscribe
- Mute
- RSS Feed
- Permalink
- Report Inappropriate Content
Hello Steve, hello Chris,
thanks for your answers. Due to weekend I couldn't answer earlier 🙂
It seems that I don't have SAS/STAT installed. I will check whether this is available for me.
Your hint Chris seems to be a good solution for me. I will try whether this works fine.
Best regards
- Mark as New
- Bookmark
- Subscribe
- Mute
- RSS Feed
- Permalink
- Report Inappropriate Content
Ok, now I calculated my trend and my table looks like this:
| Month | Units | Prediction | pctChange | trendPct | Trend |
| 2013/06 | 200000 | 0,38% | |||
| 2013/07 | 210000 | 204000 | 5,00% | 0,38% | |
| 2013/08 | 198000 | 208000 | -5,71% | 0,38% | |
| 2013/09 | 202000 | 212000 | 2,02% | 0,38% | |
| 2013/10 | 210000 | 216000 | 3,96% | 0,38% | |
| 2013/11 | 179000 | 220000 | -14,76% | 0,38% | |
| 2013/12 | 195000 | 224000 | 8,94% | 0,38% | |
| 2014/01 | 198000 | 228000 | 1,54% | 0,38% | |
| 2014/02 | 202000 | 232000 | 2,02% | 0,38% | |
| 2014/03 | 236000 | 202767,6 | |||
| 2014/04 | 240000 | 203538,117 | |||
| 2014/05 | 244000 | 204311,562 | |||
| 2014/06 | 248000 | 205087,946 | |||
| 2014/07 | 252000 | 205867,28 | |||
| 2014/08 | 256000 | 206649,576 | |||
| 2014/09 | 260000 | 207434,844 | |||
| 2014/10 | 264000 | 208223,096 | |||
| 2014/11 | 268000 | 209014,344 | |||
| 2014/12 | 272000 | 209808,599 |
Now I want to print this table in a pdf document.
Till today I only printed the "units per month" and the "prediction per month":
proc gplot data=work.unitsvsprediction;
;
plot units*monat=4 / vaxis=axis1 haxis=axis3 grid;
plot2 prediction*monat=2 / vaxis=axis2;
run;
I tried to extend this statement by plot3 trend*month.... but unfortunately proc gplot doesn't support 3 plots. Is there any other possibility to solve this?
- Mark as New
- Bookmark
- Subscribe
- Mute
- RSS Feed
- Permalink
- Report Inappropriate Content
I'm not a SAS GRAPH expert, but I do have EG so it generated this code for me when I plotted 4 different variables on the same vertical axis. It looks like you were using 2 axes, but you should still be able to adapt this and use the asterisk for the multiple series on one of the vertical axes:
PROC GPLOT DATA = WORK.SORTTempTableSorted
96 ;
97 PLOT de2_clips * date manual_clip_effort * date autokey_effort * date manual_fullpage_effort * date /
98 OVERLAY
99 VAXIS=AXIS1
100
101 HAXIS=AXIS2
102
103 FRAME LEGEND=LEGEND1
104 ;
105 /* -------------------------------------------------------------------
106 End of task code.
107 ------------------------------------------------------------------- */
108 RUN;

- Mark as New
- Bookmark
- Subscribe
- Mute
- RSS Feed
- Permalink
- Report Inappropriate Content
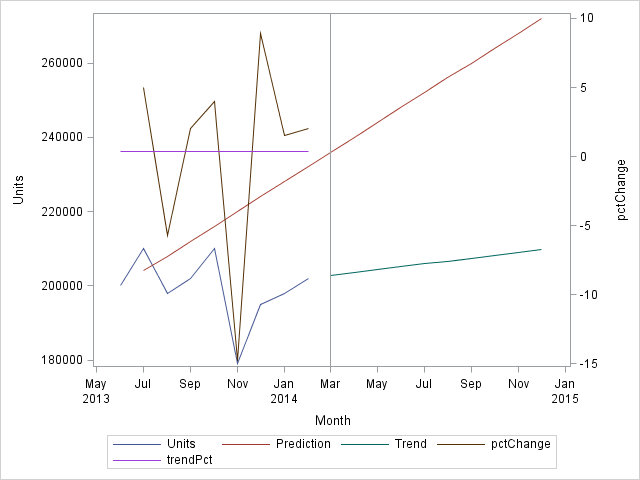
Hello -
Since your data features 2 different dimensions (% and absolute values) for Y values, you may want to look into using the SGPLOT procedure.
Here is an example (I converted your input data to an CSV file).
Thanks,
Udo
data WORK.HAVE ;
infile 'yourpath\have.csv' delimiter = ',' MISSOVER DSD firstobs=2 ;
informat Month anydtdte7. ;
informat Units best.;
informat Prediction best. ;
informat pctChange best. ;
informat trendPct best. ;
informat Trend best. ;
format Month date8. ;
format Units best. ;
format Prediction best. ;
format pctChange best. ;
format trendPct best. ;
format Trend best. ;
input Month Units Prediction pctChange trendPct Trend $;
run;
proc sgplot data=have;
series x=month y=units;
series x=month y=prediction;
series x=month y=trend;
series x=month y=pctchange /y2axis;
series x=month y=trendpct / y2axis;
run;
Results in:
- Mark as New
- Bookmark
- Subscribe
- Mute
- RSS Feed
- Permalink
- Report Inappropriate Content
Hello Chris,
thanks for your answer. The "overlay" option was the keyword. Now it works 🙂
Hello Udo,
I will also try your option with proc sgplot, as it looks very interesting and seems to help for the future 🙂
Best regards
.jpg")
Catch up on SAS Innovate 2026
Nearly 200 sessions are now available on demand in the Innovate Hub.
Watch Now →- Live Webinar: Unlocking Value With Managed Cloud Services | 16-Jun-2026
- Ask the Expert: Can Agents Reduce Planning Friction in CPG Supply Chains? | 16-Jun-2026
- Ask the Expert: Mit KI zur Höchstleistung: SAS Studio Copilot in Aktion! | 25-Jun-2026
- Ask the Expert: Get Meaningful Results With New Features in SAS Customer Intelligence 360 | 25-Jun-2026
- Ask the Expert: Modern, offen, skalierbar: Datenarchitektur mit SAS®Viya | 09-Jul-2026
- MinnSUG 2026 Annual SAS Conference | 22-Jul-2026
-
9 replies
-
03-21-2014 03:03 AM
-
12811 views
-
6 likes
-
5 in conversation
-
