BookmarkSubscribeRSS Feed
aidanm
Calcite | Level 5

Hi,

I am using PROC UNIVARIATE for my data and want only the stem and leaf plot and boxplots to show, not the normal probability plot.I already know to select the plots option to show them, but don't know how to get rid of the normal prob plot. Is there a way to do this in SAS?

1 REPLY 1
ChrisHemedinger
Community Manager

I don't think you can separate these in UNIVARIATE, but you can design the graph you want in the ODS Graph Designer.

I've done a very basic no-frills version and it produced this code:

proc template;

define statgraph Graph;

dynamic _MSRP _MSRP2 _MSRP3;

begingraph / designwidth=764 designheight=484;

   layout lattice / rowdatarange=union columndatarange=data columns=2 rowgutter=10 columngutter=10 columnweights=(0.71 0.29);

      layout overlay;

         histogram _MSRP / name='histogram_h' orient=horizontal;

      endlayout;

      layout overlay;

         boxplot y=_MSRP3 / name='box2' boxwidth=0.4 groupdisplay=Cluster clusterwidth=1.0;

      endlayout;

      rowaxes;

         rowaxis;

      endrowaxes;

   endlayout;

endgraph;

end;

run;

proc sgrender data=SASHELP.CARS template=Graph;

dynamic _MSRP="MSRP" _MSRP2="MSRP" _MSRP3="MSRP";

run;

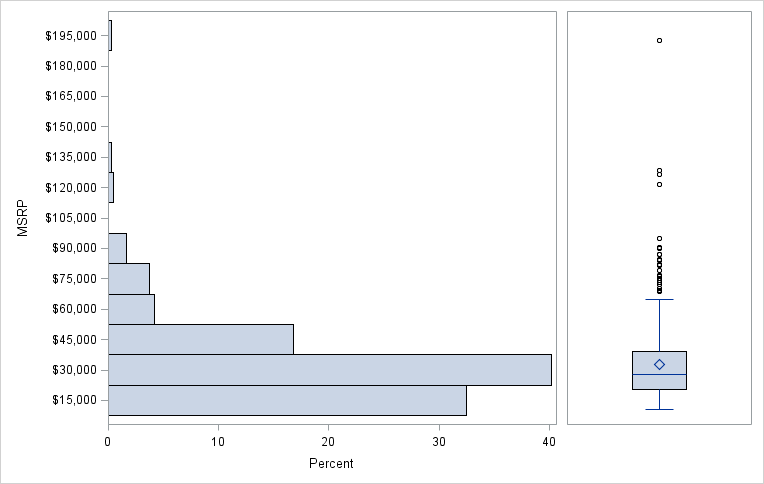
With this result when I run it:

stemleaf.png

Chris

SAS For Dummies 3rd Edition! Check out the new edition, covering SAS 9.4, SAS Viya, and all of the modern ways to use SAS!

hackathon24-white-horiz.png

The 2025 SAS Hackathon has begun!

It's finally time to hack! Remember to visit the SAS Hacker's Hub regularly for news and updates.

Latest Updates

Creating Custom Steps in SAS Studio

Check out this tutorial series to learn how to build your own steps in SAS Studio.

Find more tutorials on the SAS Users YouTube channel.

SAS Training: Just a Click Away

 Ready to level-up your skills? Choose your own adventure.

Browse our catalog!

Discussion stats
  • 1 reply
  • 1059 views
  • 1 like
  • 2 in conversation