The ODS Graphics Procedures are a great way to create high quality graphics with easy to use syntax. These procedures support a variety of plots, which can be combined to create your graph.
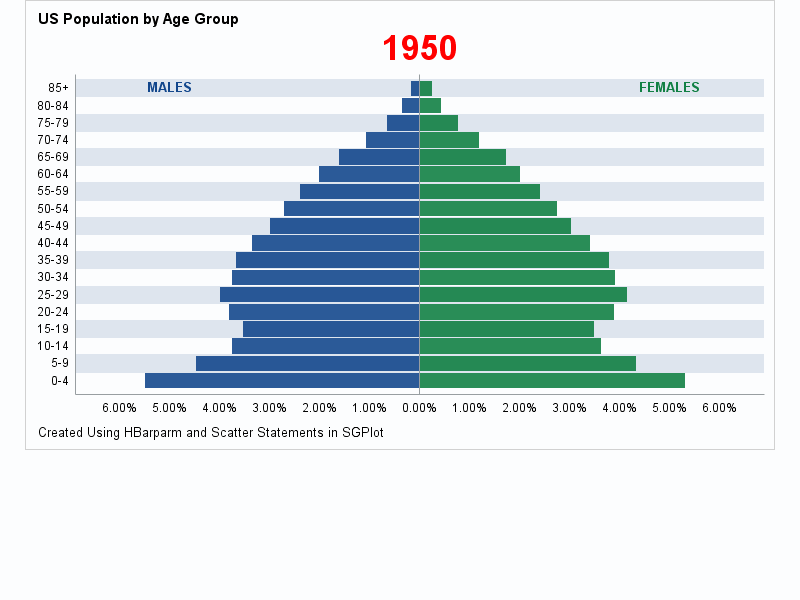
In this post, I will create an animated bar chart using the SGPLOT Procedure in SAS 9.40M2 to depict the population distribution by age group.
Steps:
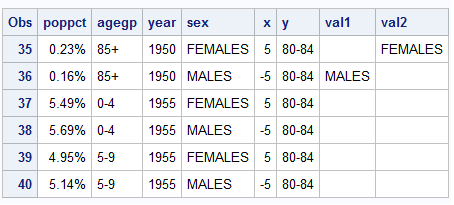
The first step is to get the summarized data set. Please note that the data used in this example is fictitious and is used to demonstrate the SGPlot example. For this plot, the data set contains the percent of US population and is divided into cohorts of different age groups. The group variable in this case is sex. In order to make the bars for the different group values appear on either sides, I have transformed the data for the population of 'MALES' to be negative so that both groups ('MALES' and 'FEMALES') can appear on either side of 0. A picture format is applied to display the transformed data as positive numbers in the graph. I have also created the necessary variables to get the gender information displayed as text on the bar chart.
Here is a snippet of the final input data set:
The next step is to create the plot using SGPLOT procedure. I have overlaid HBARPARM (horizontal bar chart) and SCATTER (scatterplot) statements to get the bar chart along with the labels for the gender. Scatter statements are used for displaying the gender information in the graph. The STYLEATTRS statement is used to control the visual attributes of the group variable. XAXIS|YAXIS statements are supplied to get the desired axes.
A handy feature of the SG procedures is that it supports BY-group processing and this is useful in generating multiple graph outputs that are used to play out the animation. Each of these outputs from the BY value acts as a key frame in the animation. I added a BY-group variable to generate the plots for every 5 years starting from 1950 to 2060. Hence, the procedure creates a bar chart for each value of the BY-group variable.
Finally, the series of images that are generated (based on the different values of the BY variable) can be played out using SAS options and ODS statements and voila, we have an animated chart!
Click Chart to view animation.
Here is the SGPlot program:
proc sgplot data=popsort noautolegend noborder nowall;
styleattrs datacolors=(VIG VIGB) datacontrastcolors=(VIG VIGB);
hbarparm category=agegp response=poppct /group=sex nooutline name="bar"
dataskin=none fillattrs=(transparency=0.1) groupdisplay=stack;
scatter y=agegp x=x/markerchar=val1 markercharattrs=(color=VIGB size=10pt
weight=bold);
scatter y=agegp x=x/markerchar=val2 markercharattrs=(color=VIG size=10pt
weight=bold);
yaxis reverse grid colorbands=even display=(noticks nolabel)
discreteorder=unformatted;
xaxis values=(-6 to 6 by 1) display=(noticks nolabel) ;
by year;
run;
In the next post, I will discuss some improvements over the current version of this animation.
.jpg")
