- Home
- /
- SAS Communities Library
- /
- Converting R data frames to SAS datafiles | SAS Viya for Learners
- RSS Feed
- Mark as New
- Mark as Read
- Bookmark
- Subscribe
- Printer Friendly Page
- Report Inappropriate Content
Converting R data frames to SAS datafiles | SAS Viya for Learners
- Article History
- RSS Feed
- Mark as New
- Mark as Read
- Bookmark
- Subscribe
- Printer Friendly Page
- Report Inappropriate Content
Get it now: A 3-1 Special on R!
If you thought we were done helping you get your data into SAS Viya for Learners (VFL), read this: you were wrong. This library article will cater to our R lovers out there. Another way to handle the 100mb restriction for uploads is to do your data preprocessing elsewhere – like R. You can then import the cleaned data into SAS VFL to use our visualizations, dashboards, advanced machine learning tools, etc.
But wait – what exactly is the 3-1 special? Well, here’s a teaser for this article, bullet point style:
- Not only will this article show you how to get your R data into SAS VFL…
- But I’ll also show academics how to access datasets stored in R packages – and upload them to VFL.
- Did you catch that, academics?
- Utilizing data in the package significantly increases the number of datasets easily accessible in VFL.
- This means that you won’t have to use banking data to illustrate machine learning in your public health class.
- Instead, just find an appropriate dataset that’s part of an R package – and transfer it over to VFL. Yay!
- And, finally, the methodology used to transfer the R data frame to SAS Data set can work on data sets larger than 100mb, with a simple hack
- So – it’s yet another way to handle the 100mb upload restriction in VFL!
Now, let’s get into those finer details. Let’s start from the top: by launching Jupyter from the main SAS Drive page:

Once Jupyter launches, you’ll see a browser akin to the following:

Since we’re in the R spirit of things, let’s open an R Notebook by clicking here:

For my example, I’m going to use data from the ggplot2 library – which is used to create graphics in R. If you’re just here to learn, then please follow along. But, if you’ve already got your own R dataset, please upload it to VFL using the approach outline in one of my earlier posts:
- https://communities.sas.com/t5/SAS-Communities-Library/Ways-to-Handle-the-100mb-Data-Upload-Restrict...
- https://communities.sas.com/t5/SAS-Communities-Library/Ways-to-Handle-the-100mb-Data-Upload-Restrict...
See what I did there? I cited myself. That’s how we get more cites.
Anyway, to access ggplot2, type the following in the first command line:

And go ahead and submit that line, if you’re eager to see output. As a reminder there are two ways to submit lines of code in Jupyter. The first is the old-school play button:

The second is to click in the cell and press Shift+Enter.
Now that ggplot2 is loaded, let’s examine which datasets are available in the package. In the second cell, type:

And submit. Yup, it’s really that easy. Now examine all the data sets – there are a lot!

Again – and sneaky, sneaky – this helps us locate data readily available for analytics. In our case, all of these datasets should be useful for visualizations – as they’re part of ggplot2 package.
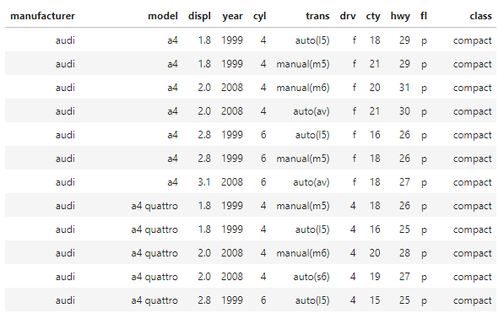
Now, let’s transfer some data from R into SAS. Since cars go vroom, vroom, the mpg data set is as good of a place to start as any. First let’s get a better understanding of mpg by examining the data. Type the following in cell 3:

A small sample of the output:

The next step is to load the R package that will help us convert the R data frame to a SAS data file. This line will load the requisite package:

Yes, foreign is the magic we’ll need. Go ahead and submit that cell. Moreover, given formatting and data structure issues that differ across R and SAS, the easiest approach to convert from R to SAS is to
- create a .TXT file of the data that you’d like to export, and
- use a SAS program to read in the data to SAS.
Wait, what? We’re going to convert the R file to .txt and then read it into SAS via a SAS program?
Yes, indeed.
To use foreign, I’ll refer you first to some good documentation, found here: https://cran.r-project.org/web/packages/foreign/foreign.pdf. The main nugget we need is on page 23:

Ponder those arguments for a bit. Let’s continue with the call that I used – and then unpack it a bit:
For my environment, this call starts with the mpg data frame. In the second argument, I then transfer the data to a .txt file saved in my casuser library. Finally, I then create mpg.sas – in the same casuser folder – which is a SAS program that will read in the .txt file.
Let’s submit that cell. We’ll know it’s done processing when the grey dot no longer appears in the tab for our Notebook:

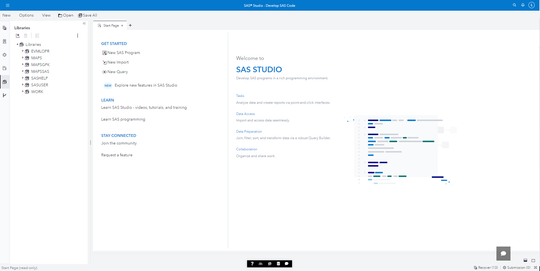
Alright, now onto the SAS Studio part of the programming. Yay! As shown in my earlier posts on Ways to Handle the 100mb Data Upload Restriction in SAS Viya for Learners, let’s navigate to SAS Studio in VFL:

Now find your casuser folder under Explorer. Ensure that mpg.sas and mpg.txt are now included in your library. The requisite clicks are shown below:

We’re getting close! The last big step is to double-click on mpg.sas to open it. Then submit.

And just like that – the R file has been converted to a SAS file. As shown from the code above, no permanent library is assigned, so we’ll find rdata in the WORK library:

One housekeeping item before we move on. It’s highly recommended that you delete the .txt file – and perhaps the R file – after you’ve uploaded your data. Why? Well, this prevents you from having duplicate information – and saves your cloud space. Moreover, you can use the compressing and file combining hacks used in my earlier posts, as need.
2 of 3 insights completed. This last one is the grand finale!
Look once more at cars.txt. In particular, open it and scroll to the end:

Do you see what I see? The cursor shows that cars.txt is an editable file – one that’s already uploaded in VFL. Thus, my spidey-senses tell me that this file can be much bigger that 100mb, so long as you cut-and-paste an equivalent data structure into the file.
And guess what? My spidey senses are correct! I artificially inflated cars.txt to 196mb by simply copying-and-pasting the same data a bunch of times:

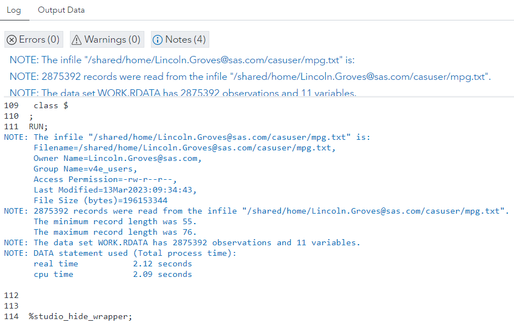
Now there was a bit of latency in the copying-and-pasting, so be patient. But the file is greater than 100mb and SAS VFL was still able to read in the file without issue:

So, ladies and gentleman, I present to you Hack #3 for getting your data larger than 100mb into SAS VFL. And this Hack came with the added bonus of showing you how to convert R data frames to SAS datasets and how to access data already part of R packages. That’s a 3-1 special!
- Mark as Read
- Mark as New
- Bookmark
- Permalink
- Report Inappropriate Content
These SAS Community Posts were part of a larger effort to support student engagement in the 2023 SAS Hackathon. Please find the full series below:
- Which Open-Source Packages are included in SAS Viya for Learners?
- Ways to Handle the 100mb Data Upload Restriction in SAS Viya for Learners, Part I
- Ways to Handle the 100mb Data Upload Restriction in SAS Viya for Learners, Part II
- Converting R data frames to SAS datafiles | SAS Viya for Learners
- Converting Python data frames to SAS datafiles | SAS Viya for Learners
SAS AI and Machine Learning Courses
The rapid growth of AI technologies is driving an AI skills gap and demand for AI talent. Ready to grow your AI literacy? SAS offers free ways to get started for beginners, business leaders, and analytics professionals of all skill levels. Your future self will thank you.

