- Home
- /
- Programming
- /
- ODS Reports
- /
- Re: Proc Report: Changing cell color and computing in grand total row
- RSS Feed
- Mark Topic as New
- Mark Topic as Read
- Float this Topic for Current User
- Bookmark
- Subscribe
- Mute
- Printer Friendly Page

- Mark as New
- Bookmark
- Subscribe
- Mute
- RSS Feed
- Permalink
- Report Inappropriate Content
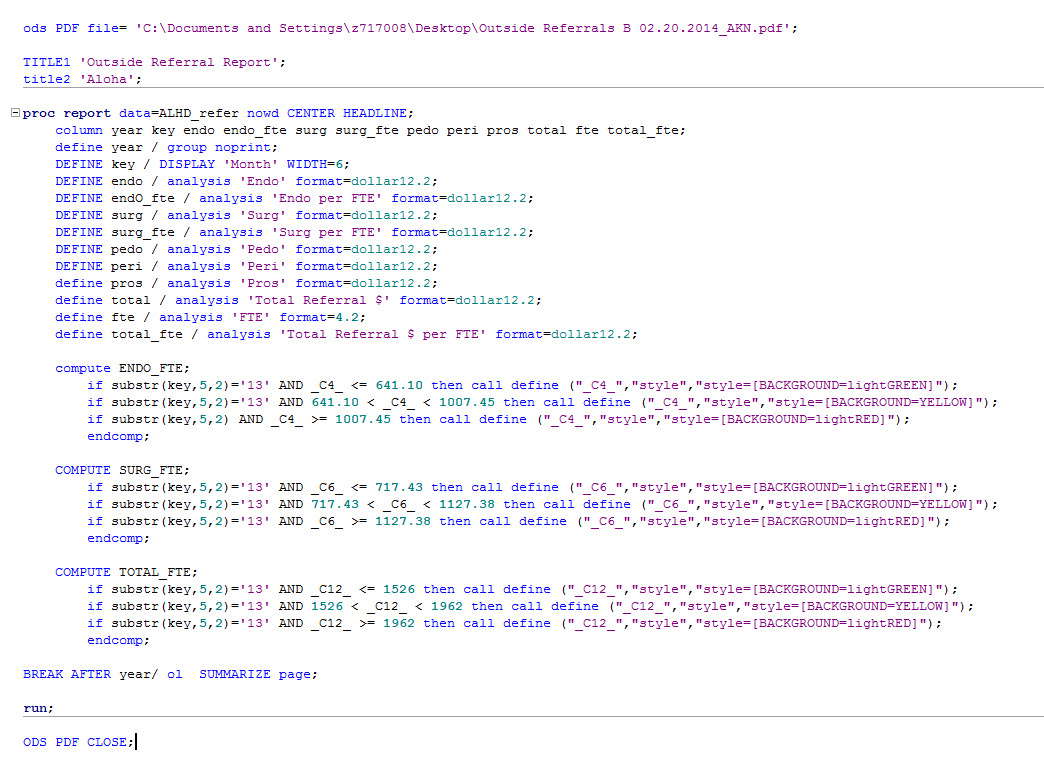
I am working on developing a code in which I would like to change the cell color of my summary row based on a different set of rules than I have used before. I would also like to perform a simple calculation instead of a grand total for tow of the cells. I would like the summary row to display the average FTE and the Total per FTE to display the sum of total divided by the average FTE. Is there a way I can do this?

- Mark as New
- Bookmark
- Subscribe
- Mute
- RSS Feed
- Permalink
- Report Inappropriate Content
HI,
Conceptually, what you want to do is possible. It would have been nice if you had provided data; however, I had a sample program that used some fake data drawn from SASHELP.PRDSALE. Consider the following code, which produces the 2 reports shown in the screen shots. Basically, you need to make some "helper" variables (I call mine BRK1, BRK2 and BRK3) to add extra break lines at the bottom. The break variable has the same value for every observation, because you only want it to total before the RBREAK. I exaggerated and made 3 extra break variables and showed you how you could perform a calculation and put a number in a specific cell or how you could put an arbitrary number in a cell. I also colored each break line differently by using the STYLE override on the BREAK line. More complicated coloring of the break line would mean a more complicated COMPUTE block where you test the value of the automatic variable _BREAK_, but you can explore that if you need to.
cynthia
data newsale;
length country $15;
set sashelp.prdsale;
where country in ('CANADA', 'GERMANY');
fake1 = (actual * predict )/1234;
fake2 = int(actual / 13);
brk1 = 1;
brk2 = 1;
brk3 = 1;
format country $15.;
run;
options orientation=portrait leftmargin=.25in rightmargin=.25in topmargin=.25in bottommargin=.25in
nodate number;
title; footnote;
ods _all_ close;
ods pdf file='c:\temp\extra_brk.pdf' notoc startpage=no;
proc report data=newsale nowd
style(report)={width=100%}
style(lines)={fontweight=bold fontsize=14pt background=white color=red};
column brk3 brk2 brk1 country division actual predict fake1 fake2;
define brk3 / group ;
define brk2 / group ;
define brk1 / group ;
define country / group;
define division / group;
define actual / analysis 'Actual' f=dollar15.;
define predict / analysis 'Predict' f=dollar15.;
define fake1 / 'Some Number' analysis sum format=comma14.2;
define fake2 / 'Other Number' sum format=comma14.;
break after country / summarize
style={background=pink};
break after brk3 / summarize
style={background=yellow};
break after brk2 / summarize
style={background=beige};
break after brk1 / summarize
style={background=verylightblue};
rbreak after / summarize
style(summary)={background=verylightgreen};
compute after BRK1;
country = 'Brk1';
actual.sum = actual.sum *10;
predict.sum = predict.sum*10;
fake1.sum = fake1.sum*10;
fake2.sum = fake2.sum*10;
endcomp;
compute after brk2;
country = 'Brk2';
actual.sum = 9999;
predict.sum = 8888;
fake1.sum = 7777;
fake2.sum = 6666;
endcomp;
compute after brk3;
country = 'Brk3';
actual.sum = 1111;
predict.sum = 2222;
fake1.sum = 3333;
fake2.sum = 4444;
endcomp;
compute before _page_;
line 'Report #1';
endcomp;
compute after;
country = 'Grand Total';
line '1) Show Extra Break Lines at Bottom of Report';
endcomp;
run;
proc report data=newsale nowd
style(report)={width=100%}
style(lines)={fontweight=bold fontsize=14pt background=white color=red};
column brk3 brk2 brk1 country division actual predict fake1 fake2;
define brk3 / group noprint;
define brk2 / group noprint;
define brk1 / group noprint;
*** . . . rest of code same as above . . .except for noprint and compute blocks;
compute before _page_;
line 'Report #2';
endcomp;
compute after;
country = 'Grand Total';
line '2) Show Extra Break Lines At Bottom of Report with NOPRINT on DEFINE';
endcomp;
run;
ods pdf close;

.jpg")
Catch up on SAS Innovate 2026
Nearly 200 sessions are now available on demand with the SAS Innovate Digital Pass.
Explore Now →Learn how use the CAT functions in SAS to join values from multiple variables into a single value.

Find more tutorials on the SAS Users YouTube channel.
SAS Training: Just a Click Away
Ready to level-up your skills? Choose your own adventure.
-
1 reply
-
02-21-2014 12:22 PM
-
4503 views
-
0 likes
-
2 in conversation
-
