- Home
- /
- Programming
- /
- Graphics
- /
- scatter plot with line of equality and observations with labels
- RSS Feed
- Mark Topic as New
- Mark Topic as Read
- Float this Topic for Current User
- Bookmark
- Subscribe
- Mute
- Printer Friendly Page

- Mark as New
- Bookmark
- Subscribe
- Mute
- RSS Feed
- Permalink
- Report Inappropriate Content
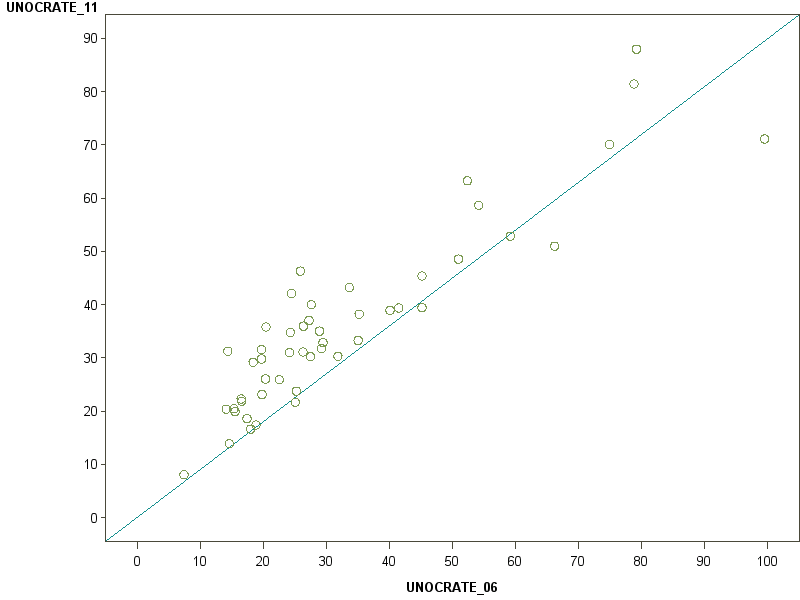
Hi I'm a bit of a newbie to SAS trying to create a scatter plot that would include the following:
- a line of equality (i.e. a diagonal line showing points where X=Y)
- data labels for individual observations
An early version of the chart is shown below? I found some example code showing how to do the diagonal line using proc gplot but was not able to figure out how to do the data labels. What would be the most effective way of doing this? Would I use proc sgcatter, proc sgplot or proc gplot? Would anyone be able to provide some example code showing how to do both using the same proc?
Thanks

- Mark as New
- Bookmark
- Subscribe
- Mute
- RSS Feed
- Permalink
- Report Inappropriate Content
Using sgplot you can use the datalabel option to specify a variable that contains a label. This all depends on how your data is set up of course:
data temp;
do i=1 to 150;
x_ref=i; y_ref=i;
output;
end;
run;
data class;
set sashelp.class temp;
run;
proc sgplot data=class;
scatter x=height y=weight/datalabel=name;
series x=x_ref y=y_ref;
xaxis min=0 max=150;
yaxis min=0 max=150;
run;quit;

- Mark as New
- Bookmark
- Subscribe
- Mute
- RSS Feed
- Permalink
- Report Inappropriate Content
And with SAS 9.3 or later, you can use the LINEPARM statement to draw the 45 degree reference line:
LINEPARM x=0 y=0 slope=1;
The line is drawn for the full data range determined by the other plots in the proc. See doc for the details.
- Mark as New
- Bookmark
- Subscribe
- Mute
- RSS Feed
- Permalink
- Report Inappropriate Content
Something new ![]()
That makes it much simpler:
proc sgplot data=sashelp.class;
scatter x=height y=weight/datalabel=name;
lineparm x=0 y=0 slope=1;
xaxis min=0 max=150;
yaxis min=0 max=150;
run;quit;
- Mark as New
- Bookmark
- Subscribe
- Mute
- RSS Feed
- Permalink
- Report Inappropriate Content
Thanks Reeza, Sanjay
For some reason lineparm statement doesn't work for me in sgplot (Error message: Statement is not valid or it is used out of proper order). Is there some general declaration that I need to do before using it? I'm using SAS EG 4.3
- Mark as New
- Bookmark
- Subscribe
- Mute
- RSS Feed
- Permalink
- Report Inappropriate Content
EG 4.3 corresponds to SAS 9.1, LINEPARM is a feature of SAS 9.2 as indicated by Sanjay.

- Mark as New
- Bookmark
- Subscribe
- Mute
- RSS Feed
- Permalink
- Report Inappropriate Content
Try this Refline Statement:
data temp;
do i=1 to 150;
x_ref=i; y_ref=i;
output;
end;
run;
data class;
set sashelp.class temp;
run;
proc sgplot data=class;
scatter x=height y=weight/datalabel=name;
refline 0 / axis = y;
xaxis min=0 max=150;
yaxis min=0 max=150;
run;
quit;
- Mark as New
- Bookmark
- Subscribe
- Mute
- RSS Feed
- Permalink
- Report Inappropriate Content
Actually, for some reason I thought you wanted a horizontal line. If you want a 45 degree line, then you can also you the VECTOR statement in SAS 9.2 onwards.
data temp;
do i=1 to 150;
x_ref=i; y_ref=i;
output;
end;
run;
data class;
set sashelp.class temp;
y = 150;
x = 150;
run;
proc sgplot data=class;
scatter x=height y=weight/datalabel=name;
vector x = x y = y / noarrowhead yorigin = 0 xorigin = 0;
xaxis min=0 max=150;
yaxis min=0 max=150;
run;
- Mark as New
- Bookmark
- Subscribe
- Mute
- RSS Feed
- Permalink
- Report Inappropriate Content
Thanks, that works.
I guess you meant to write vector x = x_ref y = y_ref / noarrowhead yorigin = 0 xorigin = 0;
- Mark as New
- Bookmark
- Subscribe
- Mute
- RSS Feed
- Permalink
- Report Inappropriate Content
Cool, glad to hear that it worked!
The reason why I wrote "vector x = x y = y" is because I wanted the diagonal line to end at 150 on the x and y axis. As you've noticed though you can also use x_ref and y_ref and the advantange of that is you do not have to create additional variables as I previously did. That's actually good for me to know, because I didn't know that before! Thanks.

- Mark as New
- Bookmark
- Subscribe
- Mute
- RSS Feed
- Permalink
- Report Inappropriate Content
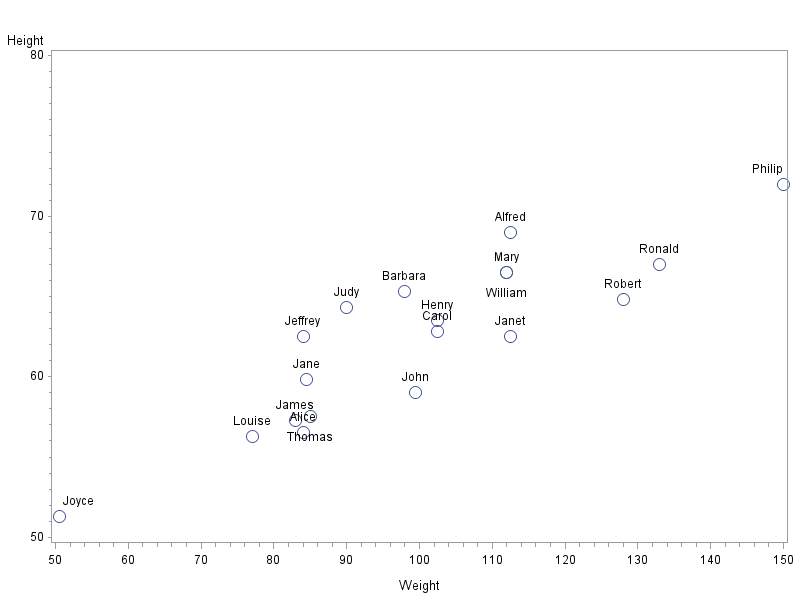
One way to add labels to the plot markers would be to use the pointlabel= option of the symbol statement.
This should work in SAS 9.1. Here is an example:
symbol1 value=circle height=2 interpol=none pointlabel=('#name');
proc gplot data=sashelp.class;
plot height*weight=1;
run;
.jpg")
Catch up on SAS Innovate 2026
Nearly 200 sessions are now available on demand in the Innovate Hub.
Watch Now →Learn how use the CAT functions in SAS to join values from multiple variables into a single value.

Find more tutorials on the SAS Users YouTube channel.
SAS Training: Just a Click Away
Ready to level-up your skills? Choose your own adventure.
-
10 replies
-
12-21-2014 11:26 PM
-
8941 views
-
2 likes
-
5 in conversation
-
