- Home
- /
- Programming
- /
- Graphics
- /
- gplot: negative and positive values on vaxis: need zero line
- RSS Feed
- Mark Topic as New
- Mark Topic as Read
- Float this Topic for Current User
- Bookmark
- Subscribe
- Mute
- Printer Friendly Page
- Mark as New
- Bookmark
- Subscribe
- Mute
- RSS Feed
- Permalink
- Report Inappropriate Content
Dear all,
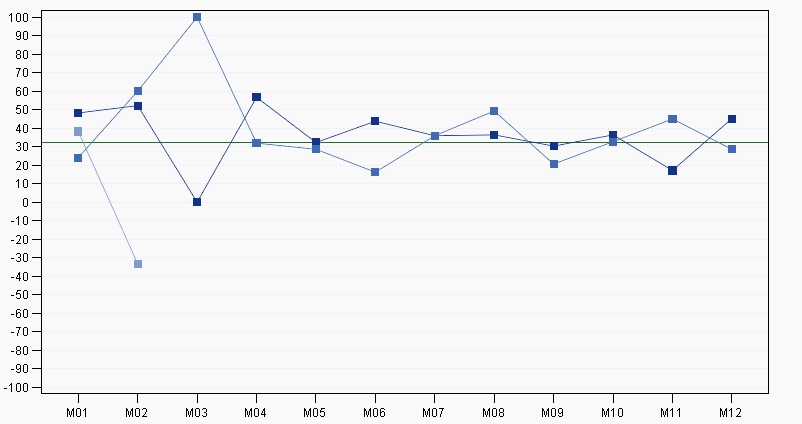
I have the following plot:

There are negative and positive values on the vaxis. And there's one referential line in green.
Unfortunately the line on zero is not displayed. I tried the trick to display another referential line on 0, but then it is also green 😞
Any better ideas?
Best wishes
Eva
Accepted Solutions
- Mark as New
- Bookmark
- Subscribe
- Mute
- RSS Feed
- Permalink
- Report Inappropriate Content
I see lines that make me think you have a light gray setting for cautovref.
You can use a color list with CVREF =(color1 color2 etc) to match you list of values for VREF where color1 and such are valid SAS color names.
- Mark as New
- Bookmark
- Subscribe
- Mute
- RSS Feed
- Permalink
- Report Inappropriate Content
Yes I have autoref:
autovref lautovref = 2 cautovref = CXeeeeee
A colorlist is great. So that's what I did:
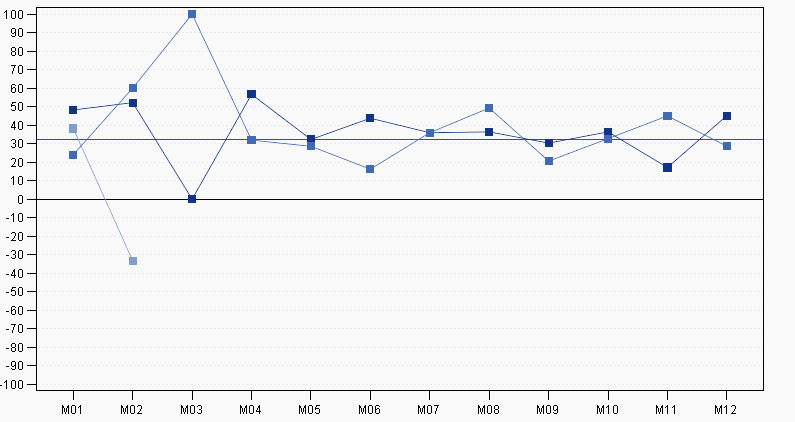
vref = (32 0) cvref = (green black)
And it works. Thanx a lot. That's the chart now:

Learn how use the CAT functions in SAS to join values from multiple variables into a single value.
Find more tutorials on the SAS Users YouTube channel.
SAS Training: Just a Click Away
Ready to level-up your skills? Choose your own adventure.


