- Home
- /
- Programming
- /
- Graphics
- /
- Re: gplot: negative and positive values on vaxis: need zero line
- RSS Feed
- Mark Topic as New
- Mark Topic as Read
- Float this Topic for Current User
- Bookmark
- Subscribe
- Mute
- Printer Friendly Page
- Mark as New
- Bookmark
- Subscribe
- Mute
- RSS Feed
- Permalink
- Report Inappropriate Content
Dear all,
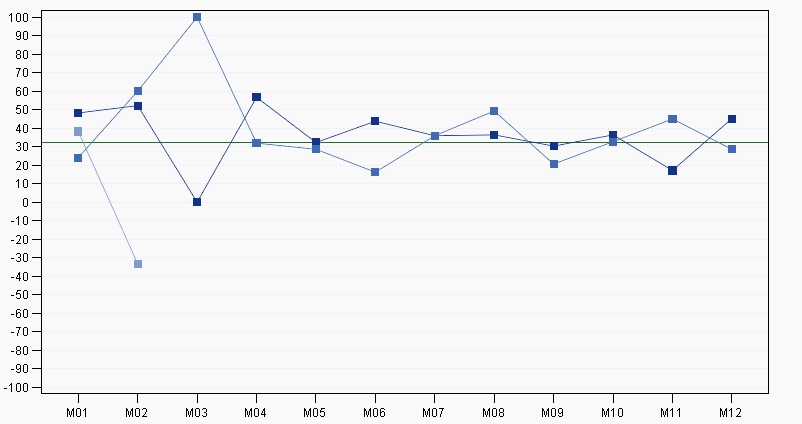
I have the following plot:

There are negative and positive values on the vaxis. And there's one referential line in green.
Unfortunately the line on zero is not displayed. I tried the trick to display another referential line on 0, but then it is also green 😞
Any better ideas?
Best wishes
Eva
Accepted Solutions
- Mark as New
- Bookmark
- Subscribe
- Mute
- RSS Feed
- Permalink
- Report Inappropriate Content
I see lines that make me think you have a light gray setting for cautovref.
You can use a color list with CVREF =(color1 color2 etc) to match you list of values for VREF where color1 and such are valid SAS color names.
- Mark as New
- Bookmark
- Subscribe
- Mute
- RSS Feed
- Permalink
- Report Inappropriate Content
Yes I have autoref:
autovref lautovref = 2 cautovref = CXeeeeee
A colorlist is great. So that's what I did:
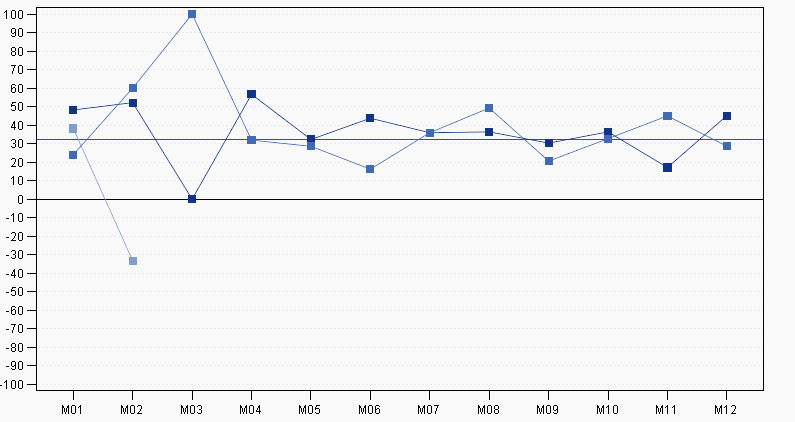
vref = (32 0) cvref = (green black)
And it works. Thanx a lot. That's the chart now:

April 27 – 30 | Gaylord Texan | Grapevine, Texas
Registration is open
Walk in ready to learn. Walk out ready to deliver. This is the data and AI conference you can't afford to miss.
Register now and save with the early bird rate—just $795!
Learn how use the CAT functions in SAS to join values from multiple variables into a single value.
Find more tutorials on the SAS Users YouTube channel.
SAS Training: Just a Click Away
Ready to level-up your skills? Choose your own adventure.


