- Home
- /
- Programming
- /
- Graphics
- /
- forest plot of subgroup
- RSS Feed
- Mark Topic as New
- Mark Topic as Read
- Float this Topic for Current User
- Bookmark
- Subscribe
- Mute
- Printer Friendly Page

- Mark as New
- Bookmark
- Subscribe
- Mute
- RSS Feed
- Permalink
- Report Inappropriate Content
data work.forest;
input subgroup $1-16 count person-yr event crude HR LowerCL UpperCL;
datalines;
age 34123 34523 74 9 0.590 0.096 3.634
<65 12451 43541 86 10 0.464 0.201 1.074
>65 23451 54211 96 11 0.394 0.076 2.055;
run;
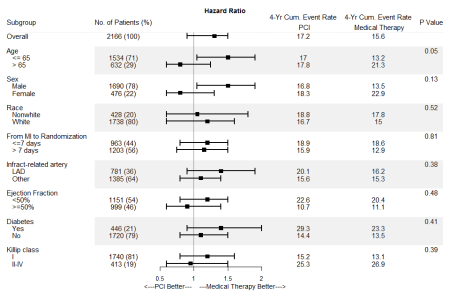
I am trying to create a forest plot that shows the above information. I want the bars to reflect the hazard ratio and lower/upper CI and all other information to be listed on the side of the bars (count, person-yr, event). Any help is much appreciated! Something that looks like the graph below but with different information.

- Mark as New
- Bookmark
- Subscribe
- Mute
- RSS Feed
- Permalink
- Report Inappropriate Content
Looks pretty darn close to this blog post:
Code is included in the post.
- Mark as New
- Bookmark
- Subscribe
- Mute
- RSS Feed
- Permalink
- Report Inappropriate Content
Thanks Reeza but this code has some errors
- Mark as New
- Bookmark
- Subscribe
- Mute
- RSS Feed
- Permalink
- Report Inappropriate Content
No errors on my side.
I used the code from here:
https://blogs.sas.com/content/graphicallyspeaking/files/2016/05/Subgrouped_Forest_Plot_SG_94.txt
You may require SAS 9.4 TS1M3 at least though.
@lillymaginta wrote:
Thanks Reeza but this code has some errors

- Mark as New
- Bookmark
- Subscribe
- Mute
- RSS Feed
- Permalink
- Report Inappropriate Content
Please post the error messages from the log, and the version of SAS (including maintenance level).
.jpg")
Catch up on SAS Innovate 2026
Nearly 200 sessions are now available on demand with the SAS Innovate Digital Pass.
Explore Now →Learn how use the CAT functions in SAS to join values from multiple variables into a single value.

Find more tutorials on the SAS Users YouTube channel.
SAS Training: Just a Click Away
Ready to level-up your skills? Choose your own adventure.
-
4 replies
-
06-14-2018 11:09 AM
-
4306 views
-
0 likes
-
3 in conversation
-
