- Home
- /
- Programming
- /
- Graphics
- /
- boxplot
- RSS Feed
- Mark Topic as New
- Mark Topic as Read
- Float this Topic for Current User
- Bookmark
- Subscribe
- Mute
- Printer Friendly Page
- Mark as New
- Bookmark
- Subscribe
- Mute
- RSS Feed
- Permalink
- Report Inappropriate Content
i have used the guied for the first time to do a box plot and i cant find the opton to add the "+" for the mean , can anyone please help me with this ?
i see from the code that its not using proc boxplot and that its using gplot , maybe its not possible to add the "+" via gplot ?
is it normal that its using gplot ?
thanks
CL
- Mark as New
- Bookmark
- Subscribe
- Mute
- RSS Feed
- Permalink
- Report Inappropriate Content
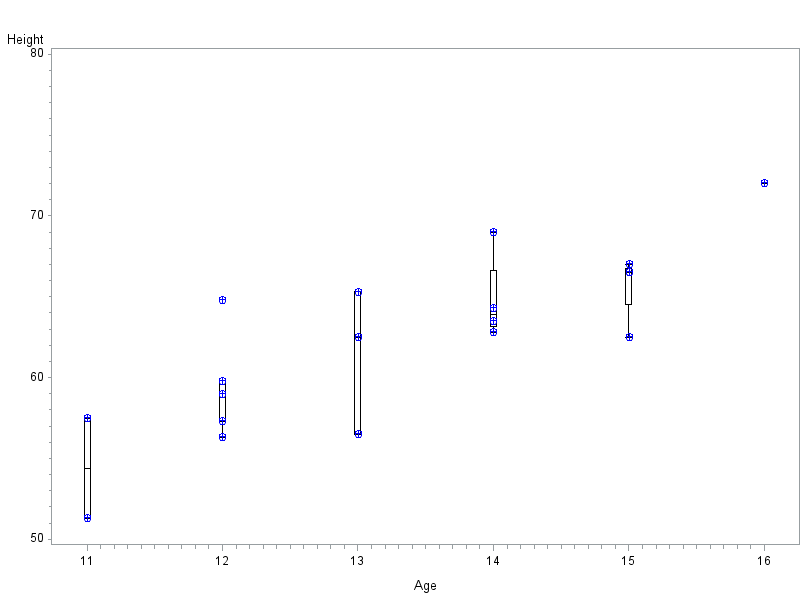
With gplot, you can do a boxplot plot, and then do a scatter plot (with the '+' character, or any character you want), and then 'overlay' them. Here is the basic syntax (you can add more options to "fancy it up" a bit!)...
symbol1 interpol=boxcti color=black;
symbol2 interpol=none value=+ color=blue;
axis1 offset=(5,5);
proc gplot data=sashelp.class;
plot height*age=1 height*age=2 / overlay haxis=axis1;
run;

Learn how use the CAT functions in SAS to join values from multiple variables into a single value.
Find more tutorials on the SAS Users YouTube channel.
SAS Training: Just a Click Away
Ready to level-up your skills? Choose your own adventure.


