- Home
- /
- Programming
- /
- Graphics
- /
- Re: Unable to see graph output in HTML and RTF when using ODS
- RSS Feed
- Mark Topic as New
- Mark Topic as Read
- Float this Topic for Current User
- Bookmark
- Subscribe
- Mute
- Printer Friendly Page
- Mark as New
- Bookmark
- Subscribe
- Mute
- RSS Feed
- Permalink
- Report Inappropriate Content
Unable to see graph output in HTML and RTF when using ODS.
I am using the below code ----
ods rtf file='C:\Users\sas\Desktop\scatter.rtf';
proc gplot data=lcs_beta.studentgpadevelopment;
plot score*forum_score;
run;
quit;
ods rtf close;
I get a blank RTF file with no graph. This is same with HTML.
- Mark as New
- Bookmark
- Subscribe
- Mute
- RSS Feed
- Permalink
- Report Inappropriate Content
hi,
i am getting success with no errors (SAS 9.2)...
please check
1)the data set exists or not
2)the output destinations in html and ods prefrences....
Please check in SAS editor ....
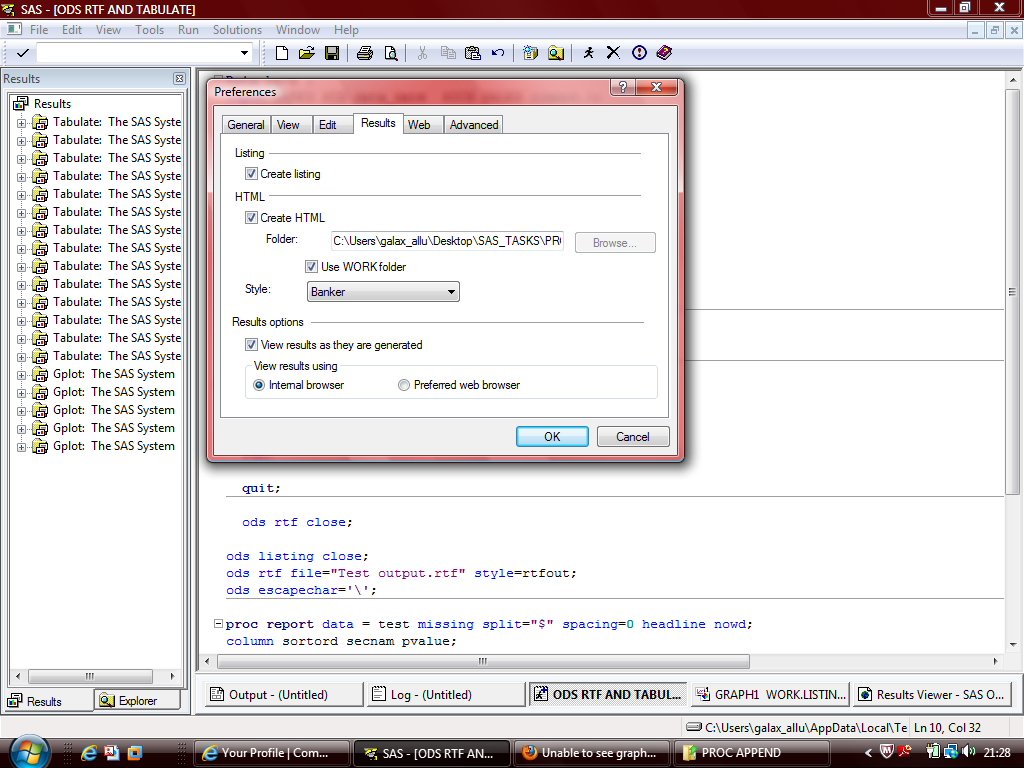
Tools...>options...>preferences,,,>results....>
please check here...how is ur settings ...???
Regards
ALLU
- Mark as New
- Bookmark
- Subscribe
- Mute
- RSS Feed
- Permalink
- Report Inappropriate Content
by using ods graphics options i can see in HTML but cannot see the output in RTF
- Mark as New
- Bookmark
- Subscribe
- Mute
- RSS Feed
- Permalink
- Report Inappropriate Content
I don't think "ods graphics on" applies to Proc Gplot.
- Mark as New
- Bookmark
- Subscribe
- Mute
- RSS Feed
- Permalink
- Report Inappropriate Content
I don't typically use rtf, so I'm not sure what's the exact best/recommended way, but the one rtf example I have uses the following syntax. Maybe give this a try. Also, how are you running SAS? ... DMS SAS, Batch SAS, EG, SAS/Connect, Stored Process, other? (I tried the following code in Batch & DMS.)
%let name=rtf001;
ods _all_ close;
ods rtf file="&name..rtf";
options nodate nonumber;
title1 "Here is my Title";
proc gplot data=sashelp.class;
plot height*weight;
run;
ods rtf close;
ods _all_ close;
- Mark as New
- Bookmark
- Subscribe
- Mute
- RSS Feed
- Permalink
- Report Inappropriate Content
Thanks, But still facing the same problem.
I cannot see the graph.
- Mark as New
- Bookmark
- Subscribe
- Mute
- RSS Feed
- Permalink
- Report Inappropriate Content
How are you running the SAS job?
Are there any errors or warnings in your log file?
Does it produce an rtf file?
How are you trying to view the rtf file?
- Mark as New
- Bookmark
- Subscribe
- Mute
- RSS Feed
- Permalink
- Report Inappropriate Content
I am running in SAS Base.
I do not get any error message. It will just open a blank RTF file.
- Mark as New
- Bookmark
- Subscribe
- Mute
- RSS Feed
- Permalink
- Report Inappropriate Content
Probably best to give tech support a call on this one...
- Mark as New
- Bookmark
- Subscribe
- Mute
- RSS Feed
- Permalink
- Report Inappropriate Content
Thanks
- Mark as New
- Bookmark
- Subscribe
- Mute
- RSS Feed
- Permalink
- Report Inappropriate Content
hi,
Did you check the OPTIONS in the SAS 9.2 editor..??/
second point please check with other name of the RTF file....like scaterr1 or scatterr2....
please find the attachment of my OPTIONS,....in SAS editor...
I got no error with your code.......except i have taken my data.....
*******************my data*********************
Data have ;
input GVKEY SID data_date SICS SALES comma6.3;
format GVKEY z6. ;
FORMAT DATA_DATE MMDDYY9.;
datalines;
001004 1 19970531 4582 46.14
001004 2 19970531 4582 34.395
001004 1 19980531 4582 53.16
001004 2 19980531 4582 39.66
001005 3 19981031 3412 189.897
001005 4 19981031 3443 26.328
001005 5 19981031 5088 31.787
;
run;
ods rtf file='C:\Users\galax_allu\Desktop\scatter.rtf';
proc gplot data=have;
plot SICS*SALES;
run;
quit;
ods rtf close;
*************************options settings for RESULTS**************88

Learn how use the CAT functions in SAS to join values from multiple variables into a single value.
Find more tutorials on the SAS Users YouTube channel.
SAS Training: Just a Click Away
Ready to level-up your skills? Choose your own adventure.


