- Home
- /
- Programming
- /
- Graphics
- /
- Log scale yaxis
- RSS Feed
- Mark Topic as New
- Mark Topic as Read
- Float this Topic for Current User
- Bookmark
- Subscribe
- Mute
- Printer Friendly Page

- Mark as New
- Bookmark
- Subscribe
- Mute
- RSS Feed
- Permalink
- Report Inappropriate Content
Hi all,
I am a new SAS user and want to present the data in log scale for y (see data and code below). But it does not work. Did I miss something? how to show minor tick marks?
Thanks
Muyi
data a;
input x y;
datalines;
0 31
2 69.4
4 78.3
6 82.4
8 51.1
10 34.1
;
run;
proc sgplot data=a;
xaxis label='x' values=(0 to 10 by 2) minor;
yaxis label='y' type=log logbase=10 ;
series x=x y=y;
run;
Accepted Solutions

- Mark as New
- Bookmark
- Subscribe
- Mute
- RSS Feed
- Permalink
- Report Inappropriate Content
Documentation says, at least for my 9.2.3 install, that when the VALUES option is used then MINOR is ignored. You might try the MIN and MAX to control range of values displayed.

- Mark as New
- Bookmark
- Subscribe
- Mute
- RSS Feed
- Permalink
- Report Inappropriate Content
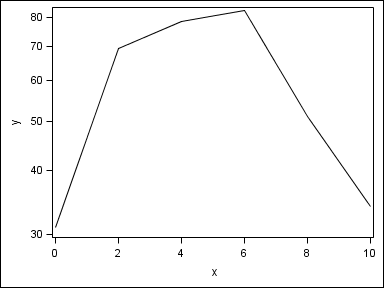
Its working in my SAS 9.3 install. Here is the graph. Note the spacing of the values on the Y axis. Default LOGSTYLE is LINEAR. You can change that to LOGEXPAND or LOGEXPONENT. Log will work as long as all the values are > 0.
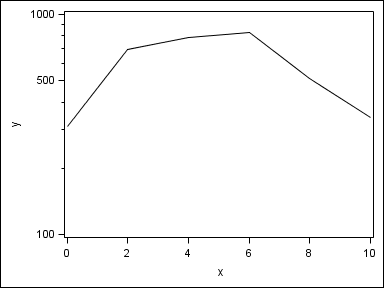
Minor only works for LOGEXPAND and LOGEXPONENT, and you need more data range. Here I scaled Y by 10:
- Mark as New
- Bookmark
- Subscribe
- Mute
- RSS Feed
- Permalink
- Report Inappropriate Content
thanks Sanjay!
I have a SAS 9.2, it works when including logstyle=logexpan, but how to show the y-axis scale range (e.g. from 0.1 to 100) and how to show the minor tick in the x-axis?
thanks
muyi
- Mark as New
- Bookmark
- Subscribe
- Mute
- RSS Feed
- Permalink
- Report Inappropriate Content
OK, it works now in my SAS 9.2 but the minor tick does not show in the x-axis, any suggestion?
data a;
input x y;
datalines;
0 31
20 694
40 783
60 824
80 511
100 341
;
run;
proc sgplot data=a;
xaxis label='x' values=(0 to 100 by 20) minor;
yaxis label='y' values=(1 to 1000) type=log logbase=10 logstyle=logexpand minor;
series x=x y=y;
run;
- Mark as New
- Bookmark
- Subscribe
- Mute
- RSS Feed
- Permalink
- Report Inappropriate Content
Minor only works with Log (LogExpand and LogExponent) and Time axis. Minor is not supported for linear axis in 9.2 and 9.3. It will be in 9.4.
- Mark as New
- Bookmark
- Subscribe
- Mute
- RSS Feed
- Permalink
- Report Inappropriate Content
Documentation says, at least for my 9.2.3 install, that when the VALUES option is used then MINOR is ignored. You might try the MIN and MAX to control range of values displayed.
- Mark as New
- Bookmark
- Subscribe
- Mute
- RSS Feed
- Permalink
- Report Inappropriate Content
Thanks all for the hlep. I love this community.
.jpg")
Catch up on SAS Innovate 2026
Nearly 200 sessions are now available on demand with the SAS Innovate Digital Pass.
Explore Now →Learn how use the CAT functions in SAS to join values from multiple variables into a single value.

Find more tutorials on the SAS Users YouTube channel.
SAS Training: Just a Click Away
Ready to level-up your skills? Choose your own adventure.
-
6 replies
-
03-25-2013 11:18 PM
-
10863 views
-
1 like
-
3 in conversation
-
