- Home
- /
- Programming
- /
- Graphics
- /
- Scatterplot with ramped color of third variable
- RSS Feed
- Mark Topic as New
- Mark Topic as Read
- Float this Topic for Current User
- Bookmark
- Subscribe
- Mute
- Printer Friendly Page
- Mark as New
- Bookmark
- Subscribe
- Mute
- RSS Feed
- Permalink
- Report Inappropriate Content
Time to get fancy. Color-coded third variable would make a particular visual assessment a lot easier. Say, ramp from Blue to Red, based on a third continuous variable. (Way too many groups to use Groups=. And too many different datasets with different numbers, so need as much generalizability as possible.)
Scouting the Internet I see various possibilities, but all seem seriously complicated.
Rick Wicklin's post looks promising. But how to translate to my need, is the question.
http://blogs.sas.com/content/iml/2014/03/26/color-scatter-plot-markers-by-a-third-variable.html
Assume that I have the following, thus far:
proc sgplot data=Have;
format N f2.0;
scatter x=x y=y / markerchar=N markercharattrs=(size=1);
run;
Thanks to DanH for that.
With that as starting point, is there a relatively easy way to get the N variable numbers on the plot to show in color as well, ramped from Blue to Red?
Assume SAS 9.4.
Any help greatly appreciated.
Nicholas Kormanik
- Tags:
- ramped color
Accepted Solutions
- Mark as New
- Bookmark
- Subscribe
- Mute
- RSS Feed
- Permalink
- Report Inappropriate Content
Whenever you have a question like this, you should look at the doc. The doc for the SCATTER statement gives the answer on the third line:
COLORRESPONSE= specifies the numeric column that is used to map colors to a gradient legend
For example:
proc sgplot data=sashelp.class;
scatter x=height y=weight / markerchar=Name colorresponse=age;
run;
If you want to change the colors used for the color ramp, you can use the COLORMODEL= option to choose from a variety of pre-built ramps, or create your own:
proc sgplot data=sashelp.class;
scatter x=height y=weight / markerchar=Name colorresponse=age
   colormodel=(blue green orange red); /* custom 4-color ramp */
run;
The COLORRESPONSE= and COLORMODEL= options were added to the SCATTER statement in SAS 9.m2 (??).
It was added to other statements (like DOT and SERIES) in SAS 9.4m3.
You can also use the TEXTPLOT statement in SAS 9.4m2. Sanjay wrote a great blog that has many examples, including chaging size and color.
For older versions of SAS, you can read this article about using the Graph Template Language (GTL) to color markers by a continuous variable.
- Mark as New
- Bookmark
- Subscribe
- Mute
- RSS Feed
- Permalink
- Report Inappropriate Content
Bummer! SAS version here is 9.4 TS Level 1M1.
Would have been extremely useful. Well, others reading your answer will benefit, no doubt.
Thank you, Rick! Wonderful that you answer so many questions.
- Mark as New
- Bookmark
- Subscribe
- Mute
- RSS Feed
- Permalink
- Report Inappropriate Content
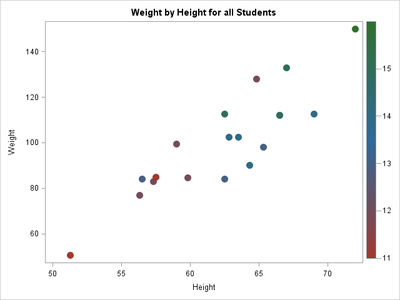
With SAS 9.40M1, you can still use the GTL SCATTERPLOT statement with the MARKERCOLORGRADIENT option. This is the same code that is eventually driven by the SGPLOT. Look up the documentation for the statement in the GTL doc.
The basic GTL code will look like this:
proc template;
define statgraph class;
begingraph;
entrytitle 'Weight by Height for all Students';
layout overlay;
scatterplot x=height y=weight / group=sex name='a' markercolorgradient=age
markerattrs=(symbol=circlefilled size=12);
continuouslegend 'a';
endlayout;
endgraph;
end;
run;
proc sgrender data=sashelp.class template=class;
run;
The COLORMODEL takes one of the predefined gradient models from the style. To change that, you have to change one in the style. The SAS 9.40M3 allows setting color model directly in syntax.
Learn how use the CAT functions in SAS to join values from multiple variables into a single value.
Find more tutorials on the SAS Users YouTube channel.
SAS Training: Just a Click Away
Ready to level-up your skills? Choose your own adventure.


