- Home
- /
- Programming
- /
- Graphics
- /
- Riser/Block graph by Lat/Long
- RSS Feed
- Mark Topic as New
- Mark Topic as Read
- Float this Topic for Current User
- Bookmark
- Subscribe
- Mute
- Printer Friendly Page
- Mark as New
- Bookmark
- Subscribe
- Mute
- RSS Feed
- Permalink
- Report Inappropriate Content
Hi everyone,
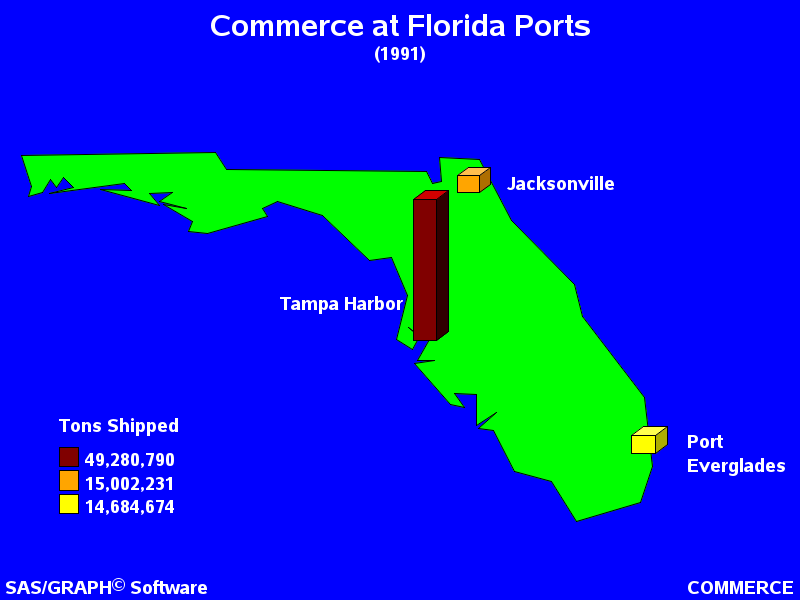
I am trying to create a block or riser map that shows the total cost of each site shown by location. The riser block height is determined by the cost and it's location on the map should be determined by the Lat/Long. I have the Lat/Long data, cost and site id... I tried using MAPS.USCITY since it appears to have both LAT LONG and X Y (projected Lat/Long in radians). My dataset has both Lat/long and I calculated X Y in radians as well. But when I assign USCITY for the Map Data source and my table for Response data source, the only ID Variable(s) Role that shows up are the STATECODE and LAT/LONG.
At first I thought that would be ok, because it would just use the lat/long, but all I ended up with is a blank result report - no map - nothing! I have read a number of documents concerning the mapping but haven't seen anything that indicates that this is possible. I find that hard to believe, so i must be missing something.
Any pointers to the appropriate documentation would be appreciated.
Regards,
Fred
- Mark as New
- Bookmark
- Subscribe
- Mute
- RSS Feed
- Permalink
- Report Inappropriate Content
What you're looking for is the trick used in Example 10 of the (now out-of-print) book "SAS/Graph Examples".
http://robslink.com/SAS/democd44/ex_10.htm <- output
http://robslink.com/SAS/democd44/ex_10_info.htm <- code

- Mark as New
- Bookmark
- Subscribe
- Mute
- RSS Feed
- Permalink
- Report Inappropriate Content
If you have a hundred or more sites, the graph might be more readable if you use circles (like a bubble plot) instead of 3-D blocks. You could make the area of each circle proportional to the quantity.
Learn how use the CAT functions in SAS to join values from multiple variables into a single value.
Find more tutorials on the SAS Users YouTube channel.
SAS Training: Just a Click Away
Ready to level-up your skills? Choose your own adventure.


