- Home
- /
- Programming
- /
- Graphics
- /
- template: issues with text/label in entrytitle and reference line
- RSS Feed
- Mark Topic as New
- Mark Topic as Read
- Float this Topic for Current User
- Bookmark
- Subscribe
- Mute
- Printer Friendly Page

- Mark as New
- Bookmark
- Subscribe
- Mute
- RSS Feed
- Permalink
- Report Inappropriate Content
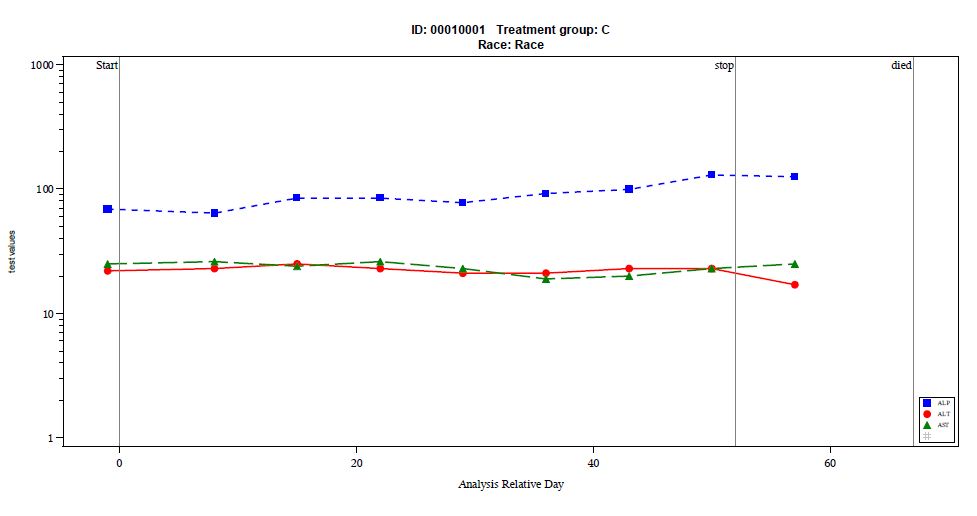
I have two issues with my template code;
1) I want to have some text at the top of the plot with ID, Treatment, sex, race and age. These are variables in the dataset.
If I use the variable name in my grender code (eg as per _trt) and use the entry title below
proc sgrender data= x template=steven;
by subjid trta;
dynamic _x = 'ady'
_y = 'aval'
_var = 'paramcd'
_trt = 'trta'
_subj = 'subjid'
_label ='test values'
;
run;
entrytitle halign=center "ID: " _subj " Treatment group: " _trt
/ textattrs=(size=10 family="Arial");
all I get is the text _subjid and _trt rather than the values. Ive got round it by using by variable but this ends up being stupid with 5 of them.
2) The second issue is that I want to have reference lines at the start (x=0) labelled start, one at the day they stopped (varies per pt) labelled stop and the same for when they died.
referenceline x=0 / lineattrs=(pattern=1) curvelabel="Start" curvelabellocation=inside;
referenceline x=died / lineattrs=(pattern=1) curvelabel="Died" curvelabellocation=inside ;
referenceline x=stop / lineattrs=(pattern=1) curvelabel="Stop" curvelabellocation=inside ;
this works fine for the x=0 line but puts the values rather than the label on the latter two.
have attached (hopefully) the program, dataset and output.
Thanks!
Adrienne M Bonwick (Adie)
- Mark as New
- Bookmark
- Subscribe
- Mute
- RSS Feed
- Permalink
- Report Inappropriate Content
ha! Formatting the variable so all the values are Died or Stop worked for the second issue.
proc format;
value died
low - high ='Died';
value stop
low - high ='Stop';
run;
data x;
set x;
format died died. stop stop.;
run;

- Mark as New
- Bookmark
- Subscribe
- Mute
- RSS Feed
- Permalink
- Report Inappropriate Content
For the first item, try this:
entrytitle halign=center "ID: " eval(colname(_subj)) " Treatment group: " _trt
/ textattrs=(size=10 family="Arial");
-or-
entrytitle halign=center "ID: " eval(collabel(_subj)) " Treatment group: " _trt
/ textattrs=(size=10 family="Arial");
Hope this helps!
Dan
- Mark as New
- Bookmark
- Subscribe
- Mute
- RSS Feed
- Permalink
- Report Inappropriate Content
entrytitle halign=center "Race: " eval(collabel(_race))
/ textattrs=(size=10 family="Arial");
gives me the same thing Race: Race (the first example Colname) gives me Race: RACE. the value of Race is Caucasian.
- Mark as New
- Bookmark
- Subscribe
- Mute
- RSS Feed
- Permalink
- Report Inappropriate Content
p.s. Im using 9.3.
.jpg")
Catch up on SAS Innovate 2026
Nearly 200 sessions are now available on demand with the SAS Innovate Digital Pass.
Explore Now →Learn how use the CAT functions in SAS to join values from multiple variables into a single value.

Find more tutorials on the SAS Users YouTube channel.
SAS Training: Just a Click Away
Ready to level-up your skills? Choose your own adventure.
-
4 replies
-
06-30-2014 10:33 AM
-
4215 views
-
0 likes
-
2 in conversation
-
