- Home
- /
- Programming
- /
- Graphics
- /
- Plotting the observation using Proc Boxplot
- RSS Feed
- Mark Topic as New
- Mark Topic as Read
- Float this Topic for Current User
- Bookmark
- Subscribe
- Mute
- Printer Friendly Page

- Mark as New
- Bookmark
- Subscribe
- Mute
- RSS Feed
- Permalink
- Report Inappropriate Content
Hello,
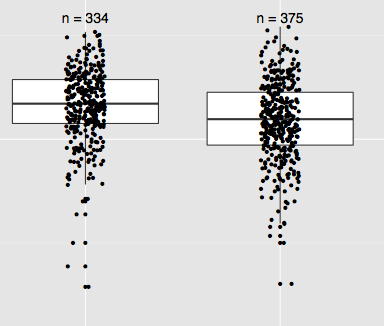
Is there a way I can plot all the observations using a BoxPlot. I don't want to use Proc Sgplot. Something like below:
Thanks

- Mark as New
- Bookmark
- Subscribe
- Mute
- RSS Feed
- Permalink
- Report Inappropriate Content
Hello,
What version of SAS have you got?
Is there a reason why you do not want to use SGPLOT? Because I have produced that graph in SGPLOT before.
Thanks
- Mark as New
- Bookmark
- Subscribe
- Mute
- RSS Feed
- Permalink
- Report Inappropriate Content
I have SAS 9.2
I prefer Proc Boxplot because I can display the inset statements to get all the summary stats.
Could you please show me how to use SGPLOT so that I may have an option as well.
Thanks
- Mark as New
- Bookmark
- Subscribe
- Mute
- RSS Feed
- Permalink
- Report Inappropriate Content
Okay thanks, that is the version I done the Boxplot and Scatterplot in.
Please look at the link below which explains how to do the plot, and show's the code:
Jitter Scatter Plot with Boxplot overlaid SAS | INNOVATION
To create the plot, I have calculated the summary statistics for the box plot, and then used the VECTOR Statement to draw the boxplot, line by line, and used the SCATTER statement to produce the Scatterplot.
It's also possible to use SGPLOT to display Summary Stats. Sanjay's article below gives more details.
http://blogs.sas.com/content/graphicallyspeaking/2012/06/17/graphical-display-of-statistics/
Just to let you know, I think there may be an easier way to produce a jittered scatterplot onto a boxplot, and I will look into that shortly. Plotting a scatterplot on a boxplot is much easier though, and this can be done in GTL.
Thanks.
- Mark as New
- Bookmark
- Subscribe
- Mute
- RSS Feed
- Permalink
- Report Inappropriate Content
Thanks for the reply. I couldn't locate the Jitter Scatter Plot code in the link you emailed me. If possible can you send me the code?
Also, by summary stats I meant to use the following statement with SGPLOT. I believe this can't be used with SGPLOT, the option that is there in BoxPlot.
| inset nobs min mean max stddev /format=10.2 header = 'Overall Statistics' | |
| pos = tm; | |
| insetgroup n min max mean Q1 Q2 Q3 stddev / format=10.2 header = 'Conc Stats'; |
- Mark as New
- Bookmark
- Subscribe
- Mute
- RSS Feed
- Permalink
- Report Inappropriate Content
That's fine. The code is below. Also yes it's possible to insert those stats within SGPLOTS but they have to be calculated before hand in Proc Means or Proc Univariate, and then merged on the dataset that you use for your plots. Sanjay's example can show you how to display those descriptive statistics on the plot, once you have merged them onto the dataset.
With SAS 9.4, it's much easier to display descriptive statistics with SGPLOT too.
If you find that you're having a lot of trouble with using the Macro or adding on the descriptive statistics, let me know and I could show you an example too.
/**********************************************************************
AUTHOR : KRISS HARRIS
AUTHOR EMAIL: [email protected]
DATE WRITTEN: JULY 2010
MACRO NAME : ROC_CUT-OFF
PURPOSE : CREATES A JITTERED SCATTERPLOT and BOXPLOT
SAS VERSION : VERSION 9.2
PARAMETERS :
-----------------------------------------------------------------------
NAME TYPE DEFAULT DESCRIPTION AND VALID VALUES
--------- -------- -------- -----------------------------------------
DATA REQUIRED : SOURCE DATASET
GROUP_CODE REQUIRED : A NUMERICAL LEVEL OF THE VARIABLE YOU WISH TO JITTER BY
FOR EXAMPLE "TREATMENT 1" COULD BE RECODED AS 1
GROUP_LABEL REQUIRED : A CATERGORICAL LEVEL OF THE VARIABLE YOU WISH TO JITTER BY
I.E. "TREATMENT A"
(E.G., OUTCOME_LEV=1)
RESPONSE REQUIRED : YOUR RESPONSE VARIABLE, I.E. THE VARIABLE YOU WISH TO PLOT
ON THE YAXIS
XAXIS_LABEL OPTIONAL : LABEL OF VARIABLE IN GRAPHICAL OUTPUT ON THE XAXIS
**************************************************************************/
/* Generating Random Data to use as an example*/
data boxplots;
CALL STREAMINIT(2);
do i = 1 to 15;
Treatment = "Treatment A";
Day = 1;
Results = RAND('NORMAL',25,10);
Group = 20;
output;
end;
do i = 16 to 30;
Treatment = "Treatment A";
Day = 2;
Results = RAND('NORMAL',35,10);
Group = 20;
output;
end;
do i = 31 to 45;
Treatment = "Treatment B";
Day = 1;
Results = RAND('NORMAL',55,10);
Group = 25;
output;
end;
do i = 46 to 60;
Treatment = "Treatment C";
Day = 2;
Results = RAND('NORMAL',65,10);
Group = 30;
output;
end;
run;
%macro jitter(
data = boxplots,
group_code = group,
group_label = treatment,
response = results,
xaxis_label = "Treatment"
);
/* Sorting the data by the group to be jittered */
proc sort data = &data;
by group;
run;
/* Assessing the number of distinct groups */
proc sql;
create table distinct_groups as
select distinct &group_code., count (distinct &group_code.) as count_groups
from boxplots;
quit;
/* Fetching the number of distinct groups */
%let dsid=%sysfunc(open(distinct_groups,i));
%let num_TN=%sysfunc(varnum(&dsid,count_groups));
%let rc=%sysfunc(fetch(&dsid,1));
%let TN=%sysfunc(getvarn(&dsid,&num_TN));
%let rc=%sysfunc(close(&dsid));
/* Multiplying the fetched number of observations by 10 */
%let TN10 = %eval(&TN*10);
/* Recoding the distinct groups to be 10,20,... etc */
data new_codes;
set distinct_groups;
new_group = _n_ * 10;
run;
/* Creating the new jittered variable using the ranuni function
Setting up the value ranges for the format statement, i.e. 9.5 to 10.5 */
proc sql;
create table merged as
select a.*, b.new_group, ranuni(44) - 0.5 as jitter,
b.new_group + calculated jitter as new_group_jittered label = &xaxis_label.,
b.new_group - 1.5 as startfmt,
b.new_group + 1.5 as endfmt
from Boxplots as a inner join new_codes as b
on a.&group_code. = b.&group_code.
order by b.new_group;
quit;
/* Selecting the distinct groups to enable the formatted values to be saved */
proc sql;
create table merged_distinct as
select distinct &group_label., new_group, startfmt, endfmt
from Merged;
quit;
/* Calculating the Mean and Median */
proc means data = merged;
by new_group;
var &response.;
output out = means_medians mean = mean median = median q1 = q1 q3 = q3 qrange = qrange min = min max = max;
run;
proc sql;
create table merged_final as
select a.*, b._FREQ_, b.mean, b.median, b.q1, b.q3,
b.qrange,
(1.5 * qrange) + b.q3 as top_whiskers,
b.q1 - (1.5 * qrange) as bottom_whiskers,
b.min,
b.max,
case when max > calculated top_whiskers then calculated top_whiskers else max end as top_whiskers_final,
case when min < calculated bottom_whiskers then calculated bottom_whiskers else min end as bottom_whiskers_final
from merged as a inner join Means_medians as b
on a.new_group = b.new_group;
quit;
/* Creating the format ranges in the datastep */
data _fmt(keep=fmtname start end label);
length start end 8 label $50;
retain fmtname 'treat' type 'n';
set merged_distinct end=eof;
if _n_=1 then do;
start=0;
end=0;
label=' ';
output;
end;
start=startfmt;
end=endfmt;
label=&group_label.;
output;
if eof then do;
start+3;
end+3;
label=' ';
output;
end;
run;
/* Creating the format using the cntlin argument */
proc format cntlin=_fmt;
run;
/* Plotting the jittered values */
proc sgplot data = merged_final;
scatter x = new_group_jittered y = &response. / group = new_group_jittered transparency = 0 ;
scatter x = new_group y = mean / markerattrs = (symbol = starfilled color = black );
format new_group_jittered treat.;
xaxis values = (10 to &TN10 by 10) valueshint offsetmax = 0.1 offsetmin = 0.1 /* Leaving some room between the left hand and right */;
vector x = endfmt y = median / noarrowheads lineattrs = (thickness = 1 color = lightblue pattern = 1 ) transparency = 0.8 xorigin = startfmt yorigin = median;
vector x = endfmt y = q1 / noarrowheads lineattrs = (thickness = 1 color = lightblue pattern = 1) transparency = 0.8 xorigin = startfmt yorigin = q1;
vector x = endfmt y = q3 / noarrowheads lineattrs = (thickness = 1 color = lightblue pattern = 1) transparency = 0.8 xorigin = startfmt yorigin = q3;
vector x = startfmt y = q3 / noarrowheads lineattrs = (thickness = 1 color = lightblue pattern = 1) transparency = 0.8 xorigin = startfmt yorigin = q1;
vector x = endfmt y = q3 / noarrowheads lineattrs = (thickness = 1 color = lightblue pattern = 1) transparency = 0.8 xorigin = endfmt yorigin = q1;
vector x = new_group y = top_whiskers_final / noarrowheads lineattrs = (thickness = 1 color = lightblue pattern = 1) transparency = 0.8 xorigin = new_group yorigin = q3;
vector x = new_group y = bottom_whiskers_final / noarrowheads lineattrs = (thickness = 1 color = lightblue pattern = 1) transparency = 0.8 xorigin = new_group yorigin = q1;
run;
/* For the Final Macro all I have to do is find out the maximum number of rows so that I can automate the tick values */
/* Doing the Macro now */
%mend;
%jitter;
- Mark as New
- Bookmark
- Subscribe
- Mute
- RSS Feed
- Permalink
- Report Inappropriate Content
Hi djrisks,
Can you help me in overlaying scatter plot on a boxplot using GTL?
Thanks

- Mark as New
- Bookmark
- Subscribe
- Mute
- RSS Feed
- Permalink
- Report Inappropriate Content
Here you can find several examples of how to produce the requested plot. I hope it helps.
.jpg")
Catch up on SAS Innovate 2026
Nearly 200 sessions are now available on demand in the Innovate Hub.
Watch Now →Learn how use the CAT functions in SAS to join values from multiple variables into a single value.

Find more tutorials on the SAS Users YouTube channel.
SAS Training: Just a Click Away
Ready to level-up your skills? Choose your own adventure.
-
7 replies
-
01-14-2015 02:19 AM
-
6259 views
-
1 like
-
3 in conversation
-
