- Home
- /
- Programming
- /
- Graphics
- /
- Re: PROC SGPLOT, SCATTER PLOT and "-" as SYMBOL ?
- RSS Feed
- Mark Topic as New
- Mark Topic as Read
- Float this Topic for Current User
- Bookmark
- Subscribe
- Mute
- Printer Friendly Page

- Mark as New
- Bookmark
- Subscribe
- Mute
- RSS Feed
- Permalink
- Report Inappropriate Content
Not with SAS 9.2. When you include a scatter plot with markerchar into the legend, you will get the swatch(s) in the legend of the same color as the markechar. This is true with any plot. With SAS 9.3 you have some new options. Or, you can use the vector plot idea I mentioned in #6 earlier.

- Mark as New
- Bookmark
- Subscribe
- Mute
- RSS Feed
- Permalink
- Report Inappropriate Content
Thanks! Have a nice weekend.
- Mark as New
- Bookmark
- Subscribe
- Mute
- RSS Feed
- Permalink
- Report Inappropriate Content
Maybe we got too wrapped up in the legend. All you really need is this. See INSET statement.
ods graphics / reset width=4in height=3in imagename='MeanMarker';
proc sgplot data=try1 noautolegend;
options orientation=landscape;
xaxis values=(0 to 4 by 1) label='Trt' ;
yaxis values=(-10 to 60 by 10) label="Something" ;
title "";
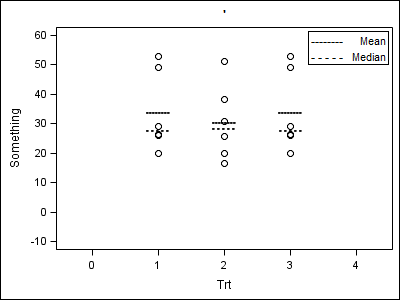
scatter x = trt y = value / markerattrs=(size=9 symbol=circle color=black) legendlabel="Individual Value" name="Ind";
scatter x = trt y = mean / MARKERCHAR=meanbar legendlabel="--- Mean" name="Mean";
scatter x = trt y = median / MARKERCHAR=mednbar legendlabel="xxx Median" name="Med";
inset ("--------" = "Mean" "- - - - -"="Median") / position=topright border;
/*keylegend "Ind" "Mean" "Med"/ title="" position=topright location=inside across=1 ;*/
run;

- Mark as New
- Bookmark
- Subscribe
- Mute
- RSS Feed
- Permalink
- Report Inappropriate Content
Dear Sunjay,
Thanks for the tip with the INSET statement (first, I left out the legend as I had same problem as John).
I think vector plot is also a good alternative. On the other hand, I liked the MARKERCHAR option, as it is easy to
use (here is an example of my graph):
Natalie
- Mark as New
- Bookmark
- Subscribe
- Mute
- RSS Feed
- Permalink
- Report Inappropriate Content
See article on blog
- Mark as New
- Bookmark
- Subscribe
- Mute
- RSS Feed
- Permalink
- Report Inappropriate Content
Dear Sanjay,
Many thanks for the detailed explanation and statment. I agree with Natalie. Maybe in the later version of SAS, some line types (e.g. solid line, dash line etc) could be considered to add into the symbol list. So the graph is even more flixable and powerful.
- « Previous
-
- 1
- 2
- Next »
.jpg")
Catch up on SAS Innovate 2026
Nearly 200 sessions are now available on demand with the SAS Innovate Digital Pass.
Explore Now →Learn how use the CAT functions in SAS to join values from multiple variables into a single value.

Find more tutorials on the SAS Users YouTube channel.
SAS Training: Just a Click Away
Ready to level-up your skills? Choose your own adventure.
-
20 replies
-
06-06-2012 05:31 AM
-
14350 views
-
0 likes
-
3 in conversation
-
