- Home
- /
- Programming
- /
- Graphics
- /
- Number format in HTML exported graph from Enterprise Guide
- RSS Feed
- Mark Topic as New
- Mark Topic as Read
- Float this Topic for Current User
- Bookmark
- Subscribe
- Mute
- Printer Friendly Page

- Mark as New
- Bookmark
- Subscribe
- Mute
- RSS Feed
- Permalink
- Report Inappropriate Content
Dear all, I´m using SAS Enterprise Guide versión 6.1 (64 bit) to generate a pie chart which I export to HTML. When I open the graph in Internet Explorer in the same computer I use to generate the graph, everything looks ok, but when I use a different computer, all the numbers in the grpah loose format!!! has anyone suffered the same problema? Can anyone help me?
Thank you,
Nicolás
Accepted Solutions

- Mark as New
- Bookmark
- Subscribe
- Mute
- RSS Feed
- Permalink
- Report Inappropriate Content
If the graphs EG is generating look different when they are viewed on different computers, then they are being rendered at the time of viewing ... which probably means you're using device=activex (which is likely, as I think that is the EG default). To guarantee the graphs look the same no matter where they're viewed, I would recommend using a static device for your output, such as device=png, or if you prefer the look of activex graphs then use device=actximg.
I'm not an EG user, so I'm not sure exactly where that setting is on the EG menus. If you have trouble finding it, perhaps post that part of the question in the EG forum.

- Mark as New
- Bookmark
- Subscribe
- Mute
- RSS Feed
- Permalink
- Report Inappropriate Content
What do you mean by lose format? Do you mean the font properties change in some fashion, or the numbers aren't lined up right, or something else?
- Mark as New
- Bookmark
- Subscribe
- Mute
- RSS Feed
- Permalink
- Report Inappropriate Content
Originally my data is in DOLLARX format so, for example, I have the number $1.000.000.000, which is displaying correctly. When I open the exported HTML graph in a computer different from the one I used to generate it, what I see is 1.0e009
Thanks for your time.
- Mark as New
- Bookmark
- Subscribe
- Mute
- RSS Feed
- Permalink
- Report Inappropriate Content
If the graphs EG is generating look different when they are viewed on different computers, then they are being rendered at the time of viewing ... which probably means you're using device=activex (which is likely, as I think that is the EG default). To guarantee the graphs look the same no matter where they're viewed, I would recommend using a static device for your output, such as device=png, or if you prefer the look of activex graphs then use device=actximg.
I'm not an EG user, so I'm not sure exactly where that setting is on the EG menus. If you have trouble finding it, perhaps post that part of the question in the EG forum.
- Mark as New
- Bookmark
- Subscribe
- Mute
- RSS Feed
- Permalink
- Report Inappropriate Content
You can change it by going into Tools -> Options -> Results - Graph, and changing the Graph Format (first drop down).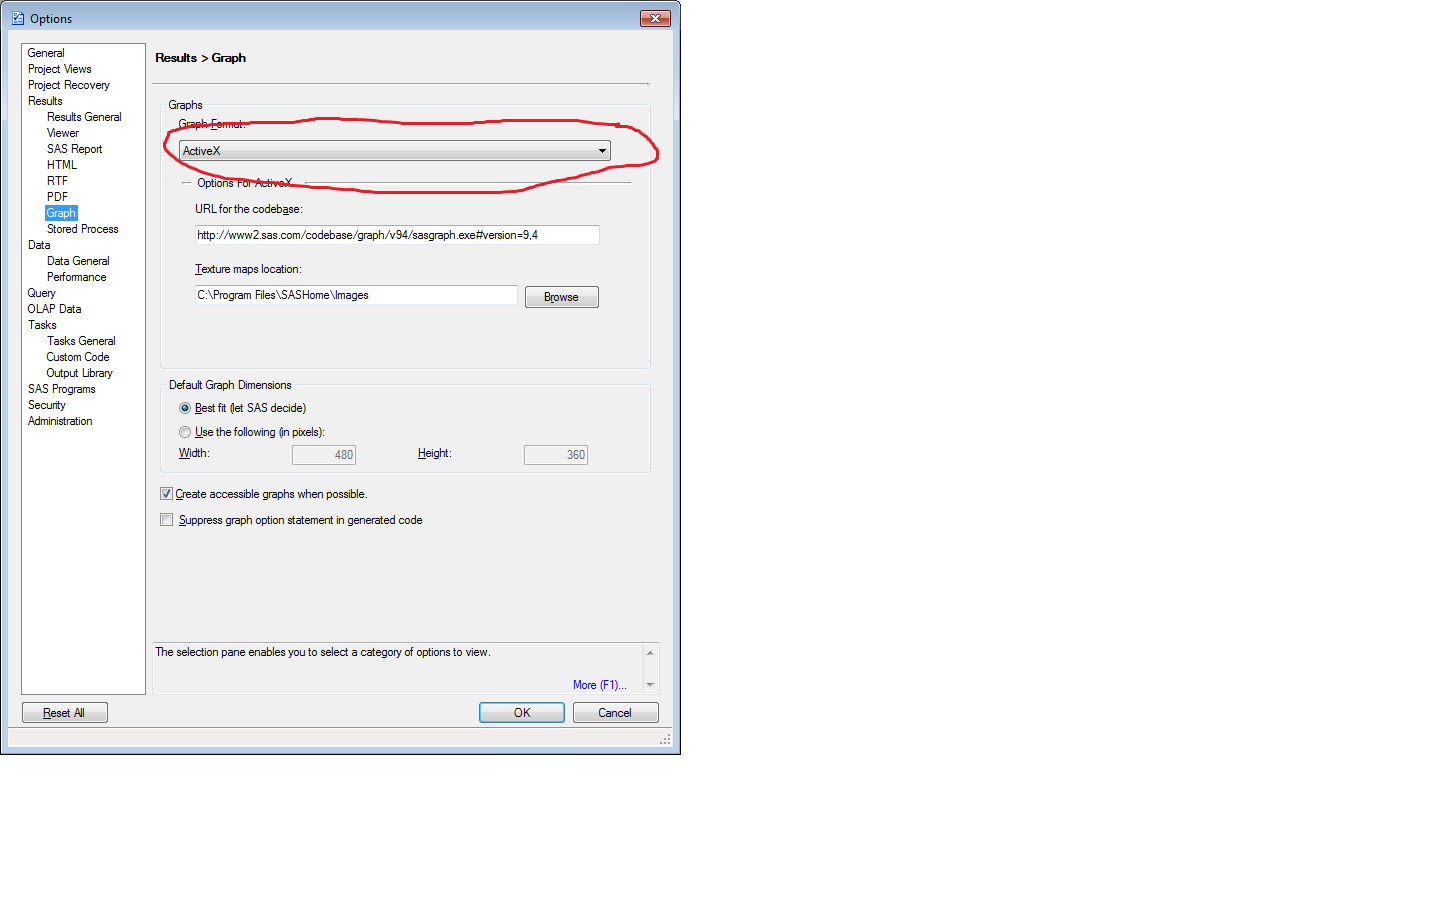
.jpg")
Catch up on SAS Innovate 2026
Nearly 200 sessions are now available on demand in the Innovate Hub.
Watch Now →Learn how use the CAT functions in SAS to join values from multiple variables into a single value.

Find more tutorials on the SAS Users YouTube channel.
SAS Training: Just a Click Away
Ready to level-up your skills? Choose your own adventure.
-
4 replies
-
08-08-2014 01:17 PM
-
3382 views
-
4 likes
-
3 in conversation
-
