- Home
- /
- Programming
- /
- Graphics
- /
- Re: Nesting variables in a bar graph?
- RSS Feed
- Mark Topic as New
- Mark Topic as Read
- Float this Topic for Current User
- Bookmark
- Subscribe
- Mute
- Printer Friendly Page

- Mark as New
- Bookmark
- Subscribe
- Mute
- RSS Feed
- Permalink
- Report Inappropriate Content
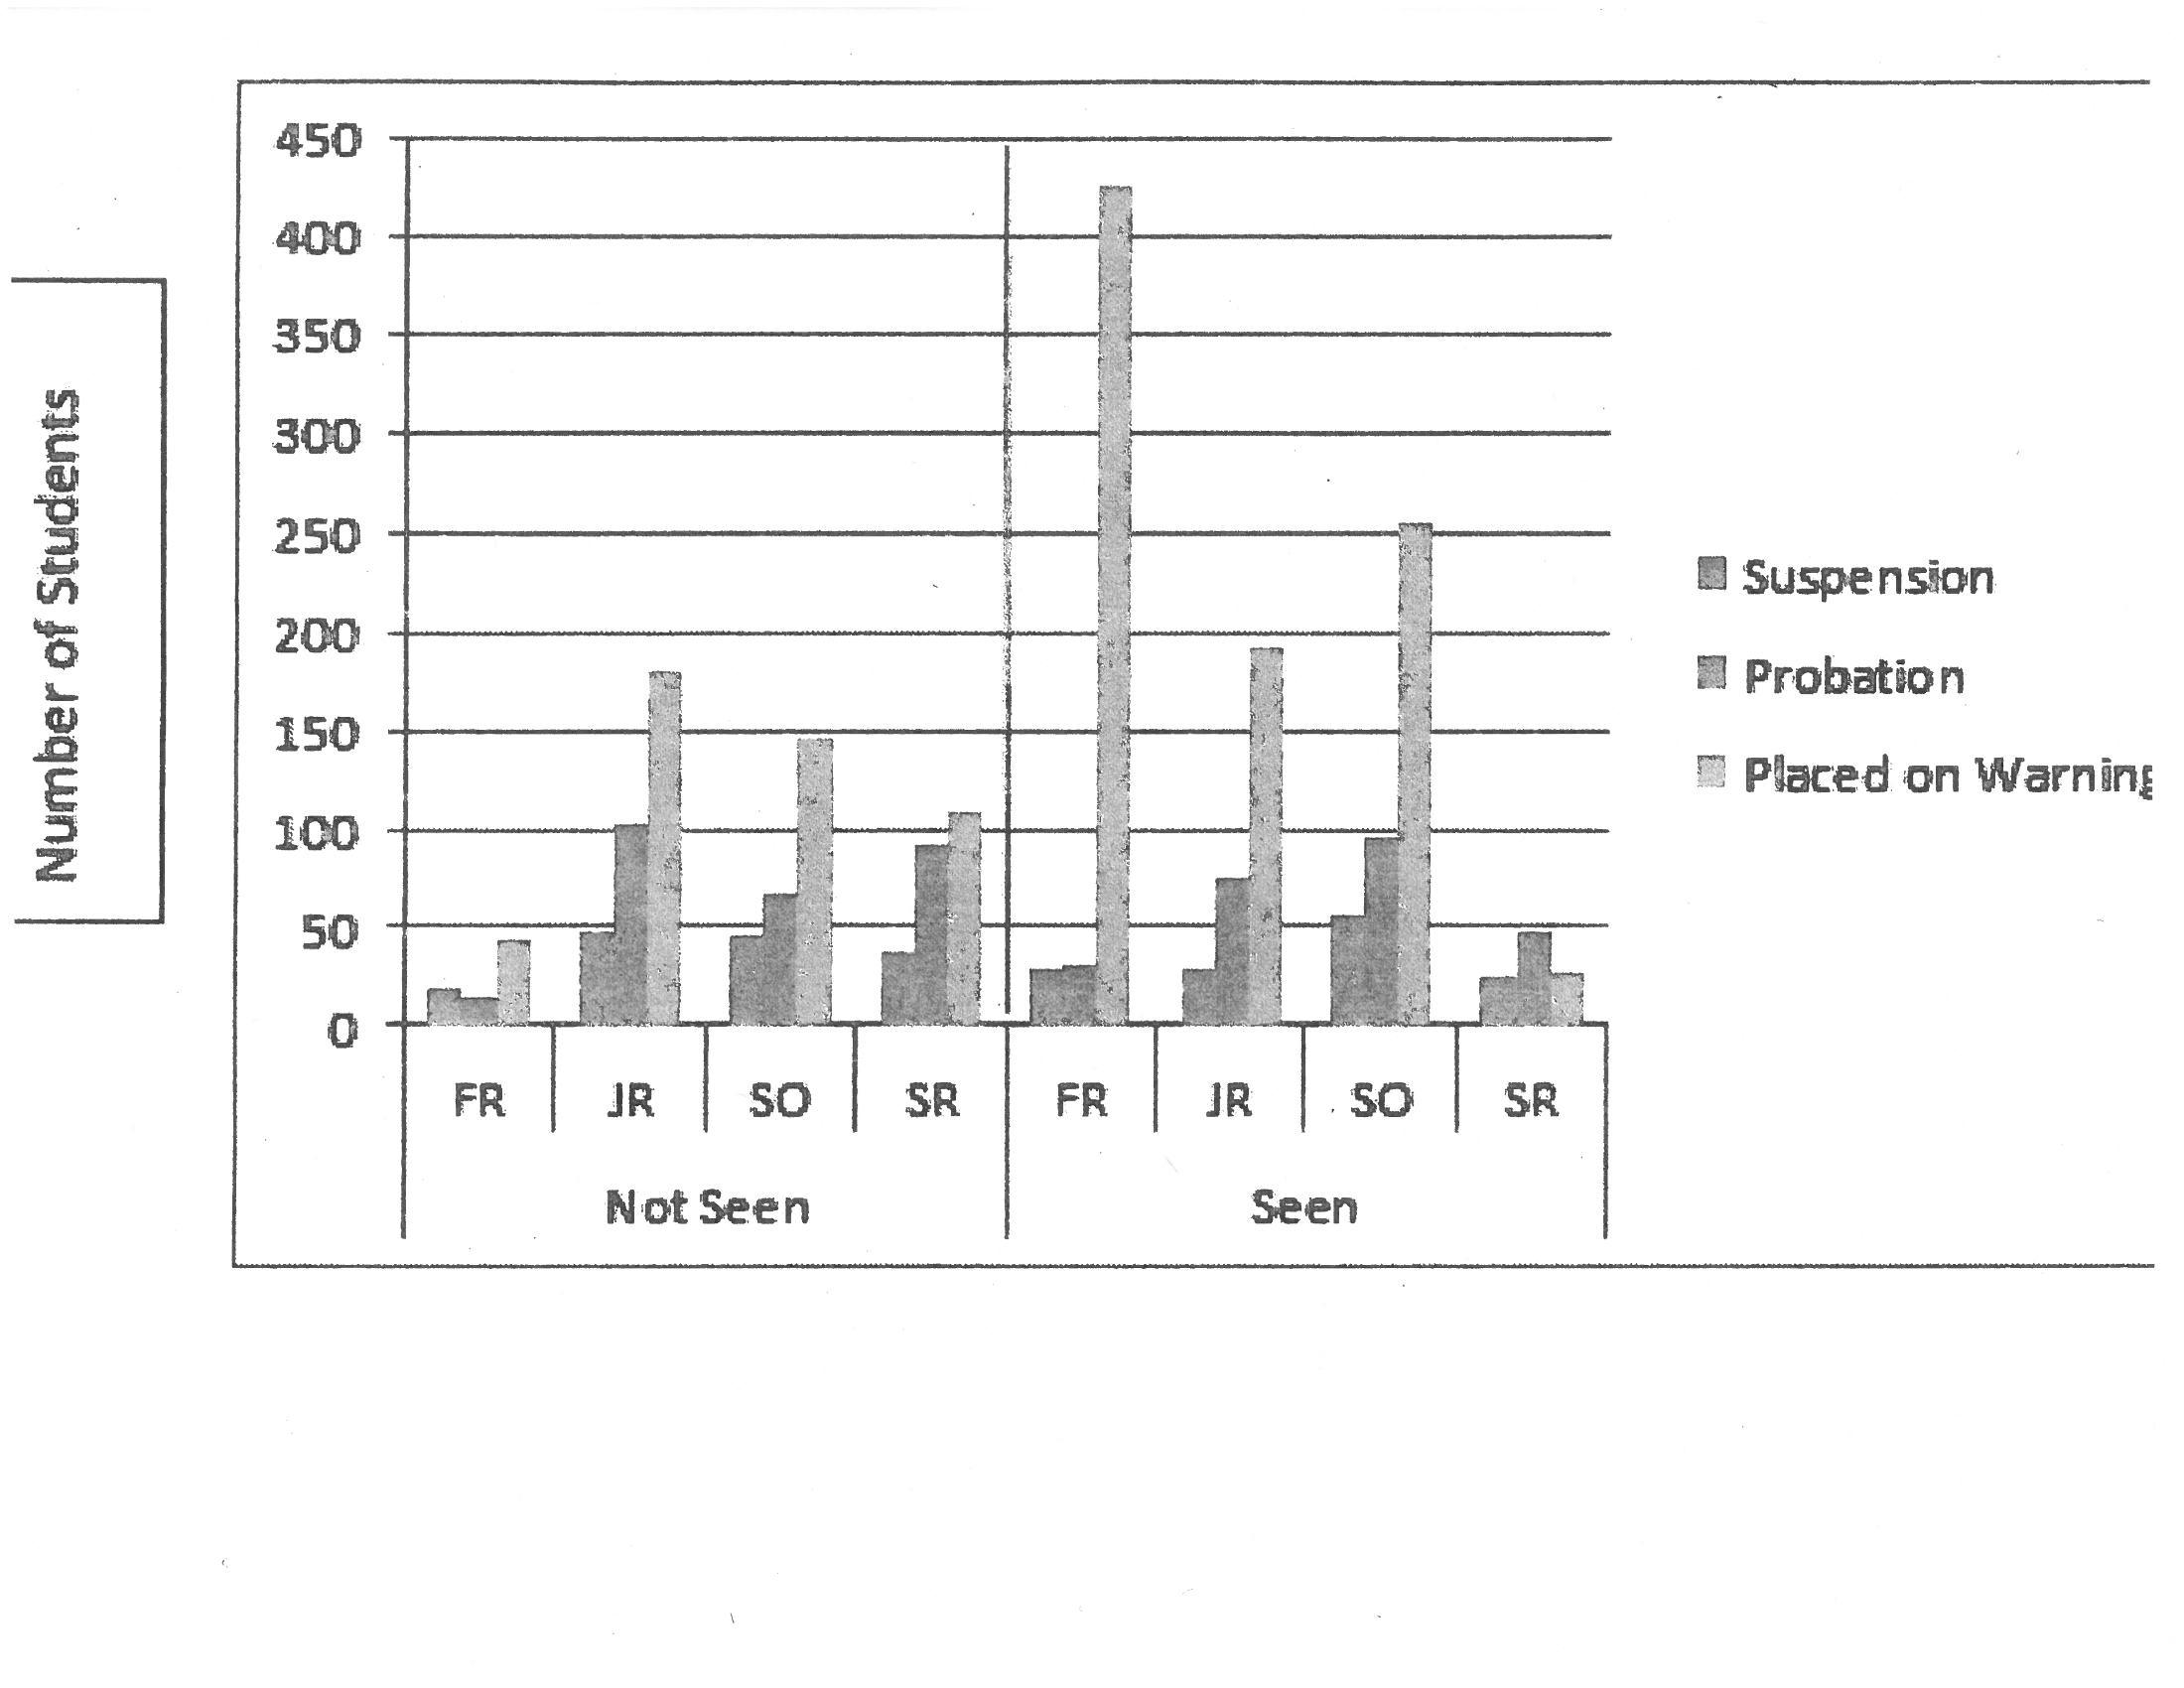
I wanted to produce a bar graph as the following (graph 1). You can see that on the horizontal axis, the "student_class" variable is nested into the "seen_notseen" variable. However, I could not figure out how to do this. The only thing I could do was produce two separate graphs, one for "seen" students and one for "notseen" students (see graphs 2a and 2b). Do you have any ideas on how I can produce a graph that looks like g
Graph 1:
Graphs 2a and 2b:
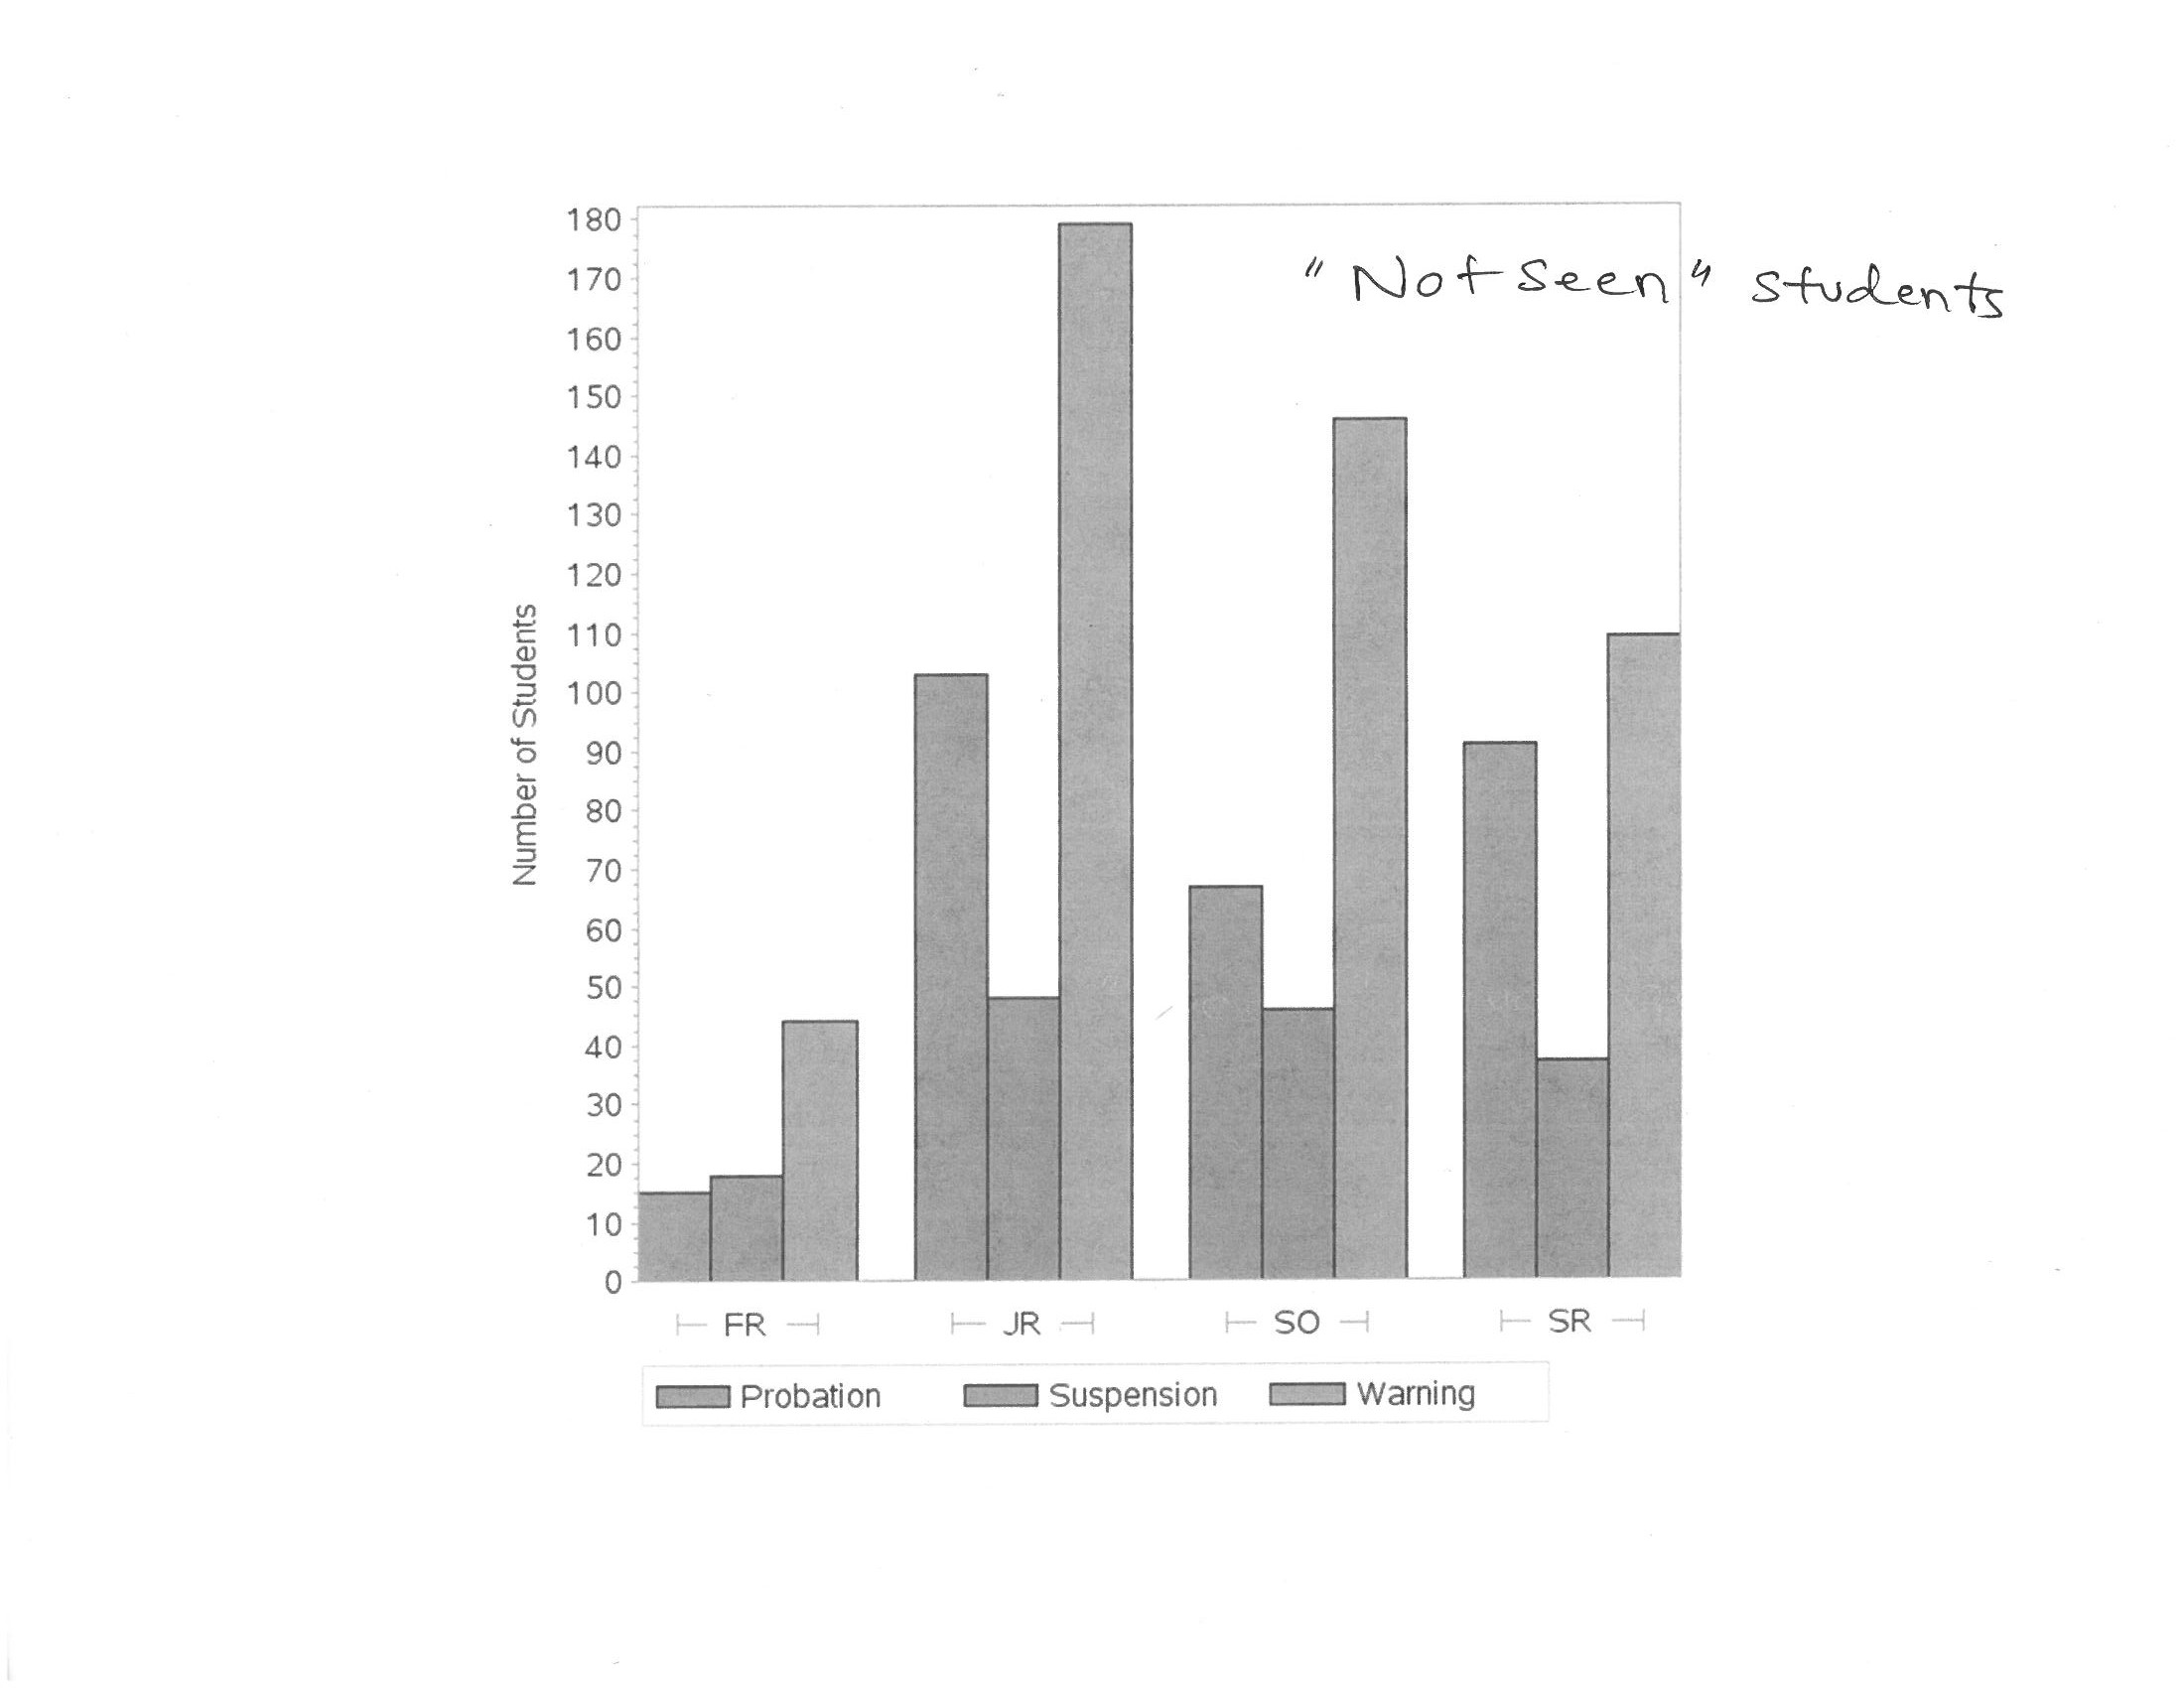
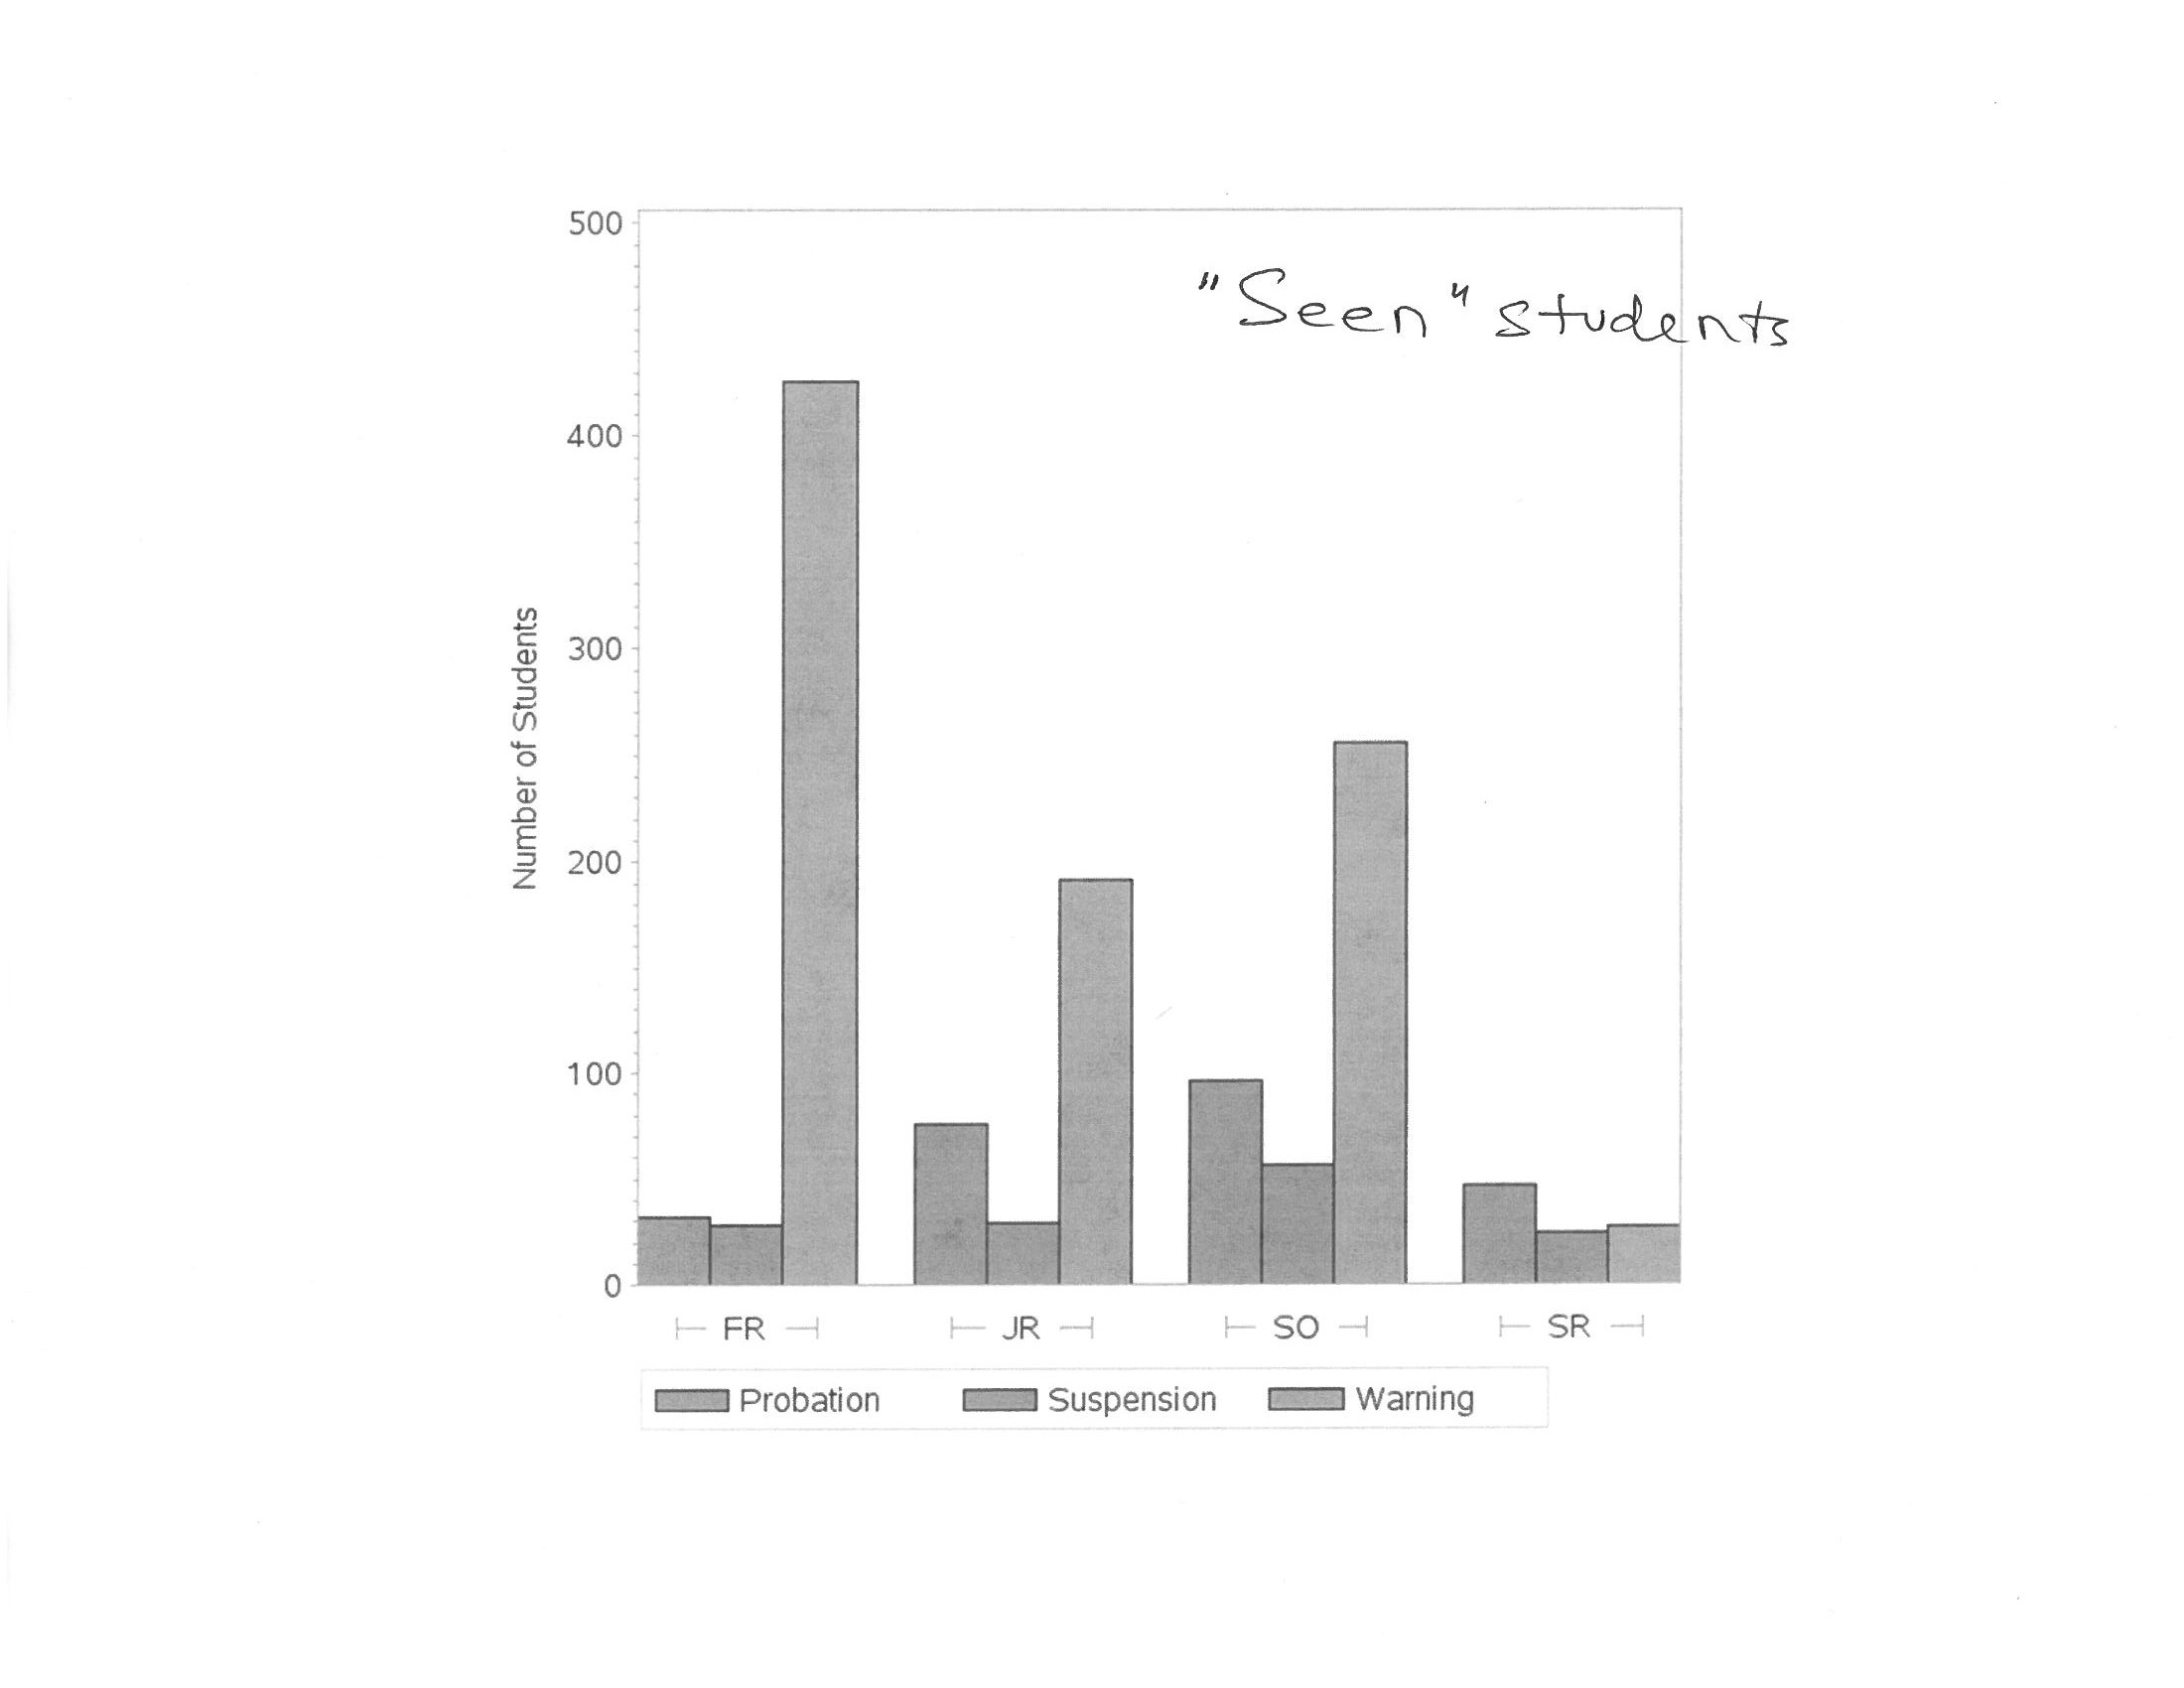
Below are the codes I used to produce graph 2a (and 2b):
| /* Set the graphics environment */ | |
| goptions reset=all cback=white border htitle=15pt htext=12pt; | |
| /* Define the axis characteristics */ | |
| axis1 value=none label=none; | |
| axis2 label=(angle=90 'Number of Students'); | |
| axis3 label=none; | |
| /* Define the legend options */ | |
| legend1 frame label=none; |
| /* Generate the graph */ | |
| title1 'Academic Standing by Class (Seen Students)'; |
proc gchart data=students_b;
where class in ('FR','SO','JR','SR') and acadstanding not in (' ','N/A') and meetingcount > 0;
format acadstanding $standing_b. class $class_b.;
vbar acadstanding /
| subgroup=acadstanding group=class type=freq | |
| legend=legend1 space=0 gspace=4 width=5 | |
| maxis=axis1 raxis=axis2 gaxis=axis3; | |
| run; | |
| quit; |

- Mark as New
- Bookmark
- Subscribe
- Mute
- RSS Feed
- Permalink
- Report Inappropriate Content
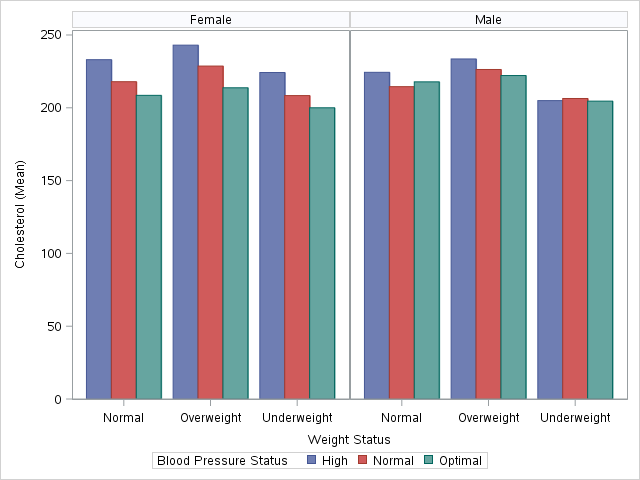
I'm not sure of your SAS version, but you can use PROC SGPANEL create this chart. Below is a similar example. If you want the headers are the bottom, use COLHEADERPOS=BOTTOM on the PANELBY statement. Hope this helps!
proc sgpanel data=sashelp.heart;
panelby sex / novarname layout=columnlattice onepanel;
vbar weight_status / response=cholesterol stat=mean group=bp_status
groupdisplay=cluster;
run;
- Mark as New
- Bookmark
- Subscribe
- Mute
- RSS Feed
- Permalink
- Report Inappropriate Content
Many thanks, Dan. Unfortunately, I am still running SAS 9.2, so the groupdisplay= option is not available; otherwise, it would be perfect. Do you have any work-around for me? Thank you.
- Mark as New
- Bookmark
- Subscribe
- Mute
- RSS Feed
- Permalink
- Report Inappropriate Content
Unfortunately, no. I had another way to approach it using overlays and DISCRETEOFFSET, but that approach requires at least SAS 9.3. Do you have access to a more recent version of SAS?
- Mark as New
- Bookmark
- Subscribe
- Mute
- RSS Feed
- Permalink
- Report Inappropriate Content
Thank you Dan. Let me ask the IT for an upgrade and will get back to you later. Thank you.
.jpg")
Catch up on SAS Innovate 2026
Dive into keynotes, announcements and breakthroughs on demand.
Explore Now →Learn how use the CAT functions in SAS to join values from multiple variables into a single value.

Find more tutorials on the SAS Users YouTube channel.
SAS Training: Just a Click Away
Ready to level-up your skills? Choose your own adventure.
-
4 replies
-
03-19-2015 03:21 PM
-
3385 views
-
4 likes
-
2 in conversation
-
