- Home
- /
- Programming
- /
- Graphics
- /
- Marker Size for different ODS destinations
- RSS Feed
- Mark Topic as New
- Mark Topic as Read
- Float this Topic for Current User
- Bookmark
- Subscribe
- Mute
- Printer Friendly Page
- Mark as New
- Bookmark
- Subscribe
- Mute
- RSS Feed
- Permalink
- Report Inappropriate Content
Here's simple SGPLOT syntax.
proc sgplot data=Class;
scatter x=Height y=Weight / markerattrs=(size=8pt symbol=CircleFilled color=DarkRed);
run;
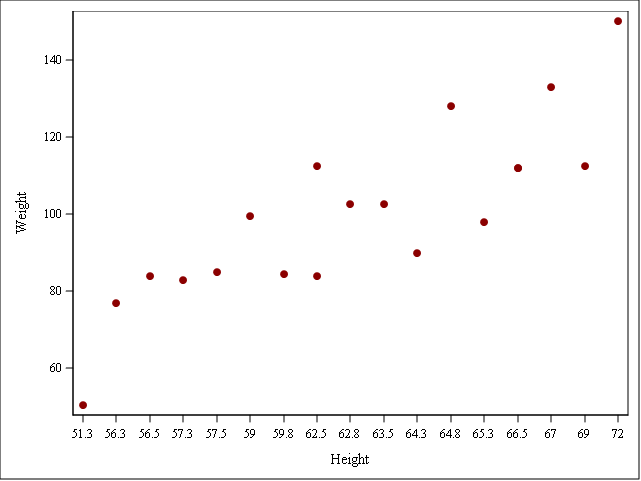
ODS RTF/SASReport destinations produces this:

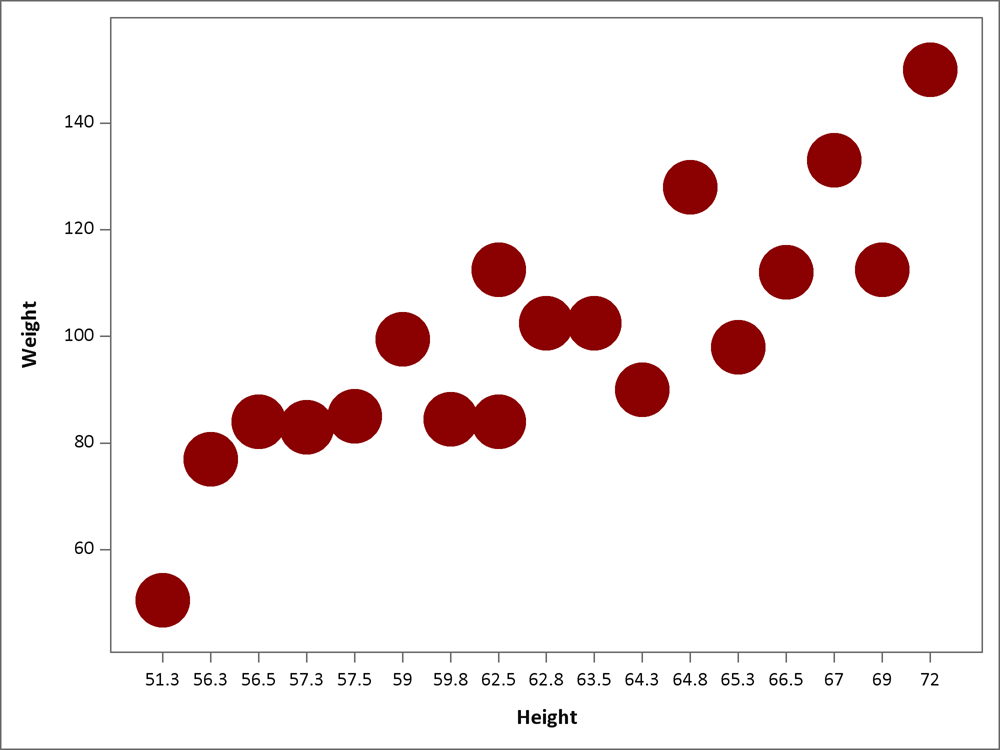
ODS PDF/PowerPoint destinations produce something completely different:

Why are MARKER sizes interpreted differently by SASReport/RTF and PDF/PowerPoint? Especially strange is the differential behavior of the two MS destinations!
How do I get comparable output in different simultaneous ODS destinations?
Thanks,
Haris
- Mark as New
- Bookmark
- Subscribe
- Mute
- RSS Feed
- Permalink
- Report Inappropriate Content
If you haven't tried yet, specify the size in IN, MM or CM. I'm not sure that PT gets treated the same.
Also use the same ODS Style. The default for different destinations can change things.
- Mark as New
- Bookmark
- Subscribe
- Mute
- RSS Feed
- Permalink
- Report Inappropriate Content
Thanks, good suggestions! Unfortunately, it does not work. Specifying the size in cm/mm/in makes no difference. Specifying the same style for different ODS destination changes the appearance but not the marker size.
- Mark as New
- Bookmark
- Subscribe
- Mute
- RSS Feed
- Permalink
- Report Inappropriate Content
Markers in PDF and Powerpoint output look the same at SAS 9.4M2. Markers in RTF and LIsting look the same too, but smaller than first two, but not as much as your examples. We'll dig further.
- Mark as New
- Bookmark
- Subscribe
- Mute
- RSS Feed
- Permalink
- Report Inappropriate Content
Thanks Sanjay. I am running 9.4 TS1M0. Also may be relevant--I am running the syntax via Enterprise Guide, not SAS directly. Have not tried in SAS proper.
- Mark as New
- Bookmark
- Subscribe
- Mute
- RSS Feed
- Permalink
- Report Inappropriate Content
A defect has been fixed for this issue in SAS 9.40M3.
- Mark as New
- Bookmark
- Subscribe
- Mute
- RSS Feed
- Permalink
- Report Inappropriate Content
Good news! Thanks!
How do I get this? Is this a hot fix or a whole new release of SAS that would need to upgrade to? I don't know much about installations and my IT don't know much about SAS either.
Thanks,
Haris
Learn how use the CAT functions in SAS to join values from multiple variables into a single value.
Find more tutorials on the SAS Users YouTube channel.
SAS Training: Just a Click Away
Ready to level-up your skills? Choose your own adventure.


