- Home
- /
- Programming
- /
- Graphics
- /
- Maps with GTL & SGRENDER?
- RSS Feed
- Mark Topic as New
- Mark Topic as Read
- Float this Topic for Current User
- Bookmark
- Subscribe
- Mute
- Printer Friendly Page
- Mark as New
- Bookmark
- Subscribe
- Mute
- RSS Feed
- Permalink
- Report Inappropriate Content
Hi,
Is it possible to create US and world maps using GTL and SGRENDER?
I know PROC GMAP creates nice maps, I was curious if there is a SG version for GMAP.
Thank you.
Anca.
Accepted Solutions
- Mark as New
- Bookmark
- Subscribe
- Mute
- RSS Feed
- Permalink
- Report Inappropriate Content
I assume this is more of a question about processing the map polygons, and determining which counties border other counties, so you can then determine the correlations (using non-graphical techniques), before you then plot the data on a map(?)
Here's some code that might help - given a county, it can determine the other counties with adjacent borders. You could then apply such code to every county, to determine the adjacent counties to each of them (which would be quite a bit of work, and data management).
- Mark as New
- Bookmark
- Subscribe
- Mute
- RSS Feed
- Permalink
- Report Inappropriate Content
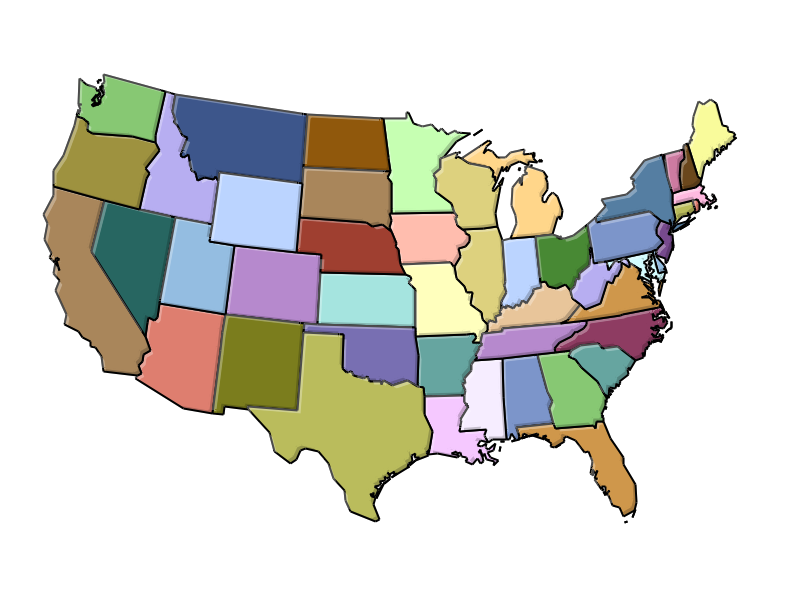
There is no SG procedure for maps. However, depending on your needs, and the version of SAS you are using, you can create simple maps using SGPLOT or GTL and map data sets.
With SAS 9.2, you can create outline maps as shown in this article.
SAS 9.4M1 release includes the new POLYGON plot statement. This statement plots any arbitrary polygon, including map regions. You can overlay any other compatible plot statement on it as long as you can merge the data correctly into one data set. I posted one article on Polygon Plot earlier describing its features which can be customized to draw maps. Here's one example. If this is of interest to you, I can provide more information.

- Mark as New
- Bookmark
- Subscribe
- Mute
- RSS Feed
- Permalink
- Report Inappropriate Content
Thank you, Sanjay.
I use SAS 9.3. You have provided useful information.
My other question is re:counties level US map. I can (easily) create a US map at the county level, however, I need to create a 'smooth' county level US map.
In other words, I need to create a map that will account for the correlation between the bordering counties.
I know there is modelling involved in creating the correlations associated with the counties and what not, but before I dig into that, I thought I'd ask if there is some option in PROC GMAP to turn ON the 'smooth'ness.
Thank you, Sanjay!
- Mark as New
- Bookmark
- Subscribe
- Mute
- RSS Feed
- Permalink
- Report Inappropriate Content
I will let other experts (Robert?) address this GMAP question.
- Mark as New
- Bookmark
- Subscribe
- Mute
- RSS Feed
- Permalink
- Report Inappropriate Content
I assume this is more of a question about processing the map polygons, and determining which counties border other counties, so you can then determine the correlations (using non-graphical techniques), before you then plot the data on a map(?)
Here's some code that might help - given a county, it can determine the other counties with adjacent borders. You could then apply such code to every county, to determine the adjacent counties to each of them (which would be quite a bit of work, and data management).
- Mark as New
- Bookmark
- Subscribe
- Mute
- RSS Feed
- Permalink
- Report Inappropriate Content
You are correct.
I wanted to check there is not an easier way to account for the correlation, and the links you sent are very helpful.
Thank you.
Anca.
April 27 – 30 | Gaylord Texan | Grapevine, Texas
Registration is open
Walk in ready to learn. Walk out ready to deliver. This is the data and AI conference you can't afford to miss.
Register now and save with the early bird rate—just $795!
Learn how use the CAT functions in SAS to join values from multiple variables into a single value.
Find more tutorials on the SAS Users YouTube channel.
SAS Training: Just a Click Away
Ready to level-up your skills? Choose your own adventure.


