- Home
- /
- Programming
- /
- Graphics
- /
- Is there any efficient way to draw broken axis graph in SAS?
- RSS Feed
- Mark Topic as New
- Mark Topic as Read
- Float this Topic for Current User
- Bookmark
- Subscribe
- Mute
- Printer Friendly Page

- Mark as New
- Bookmark
- Subscribe
- Mute
- RSS Feed
- Permalink
- Report Inappropriate Content
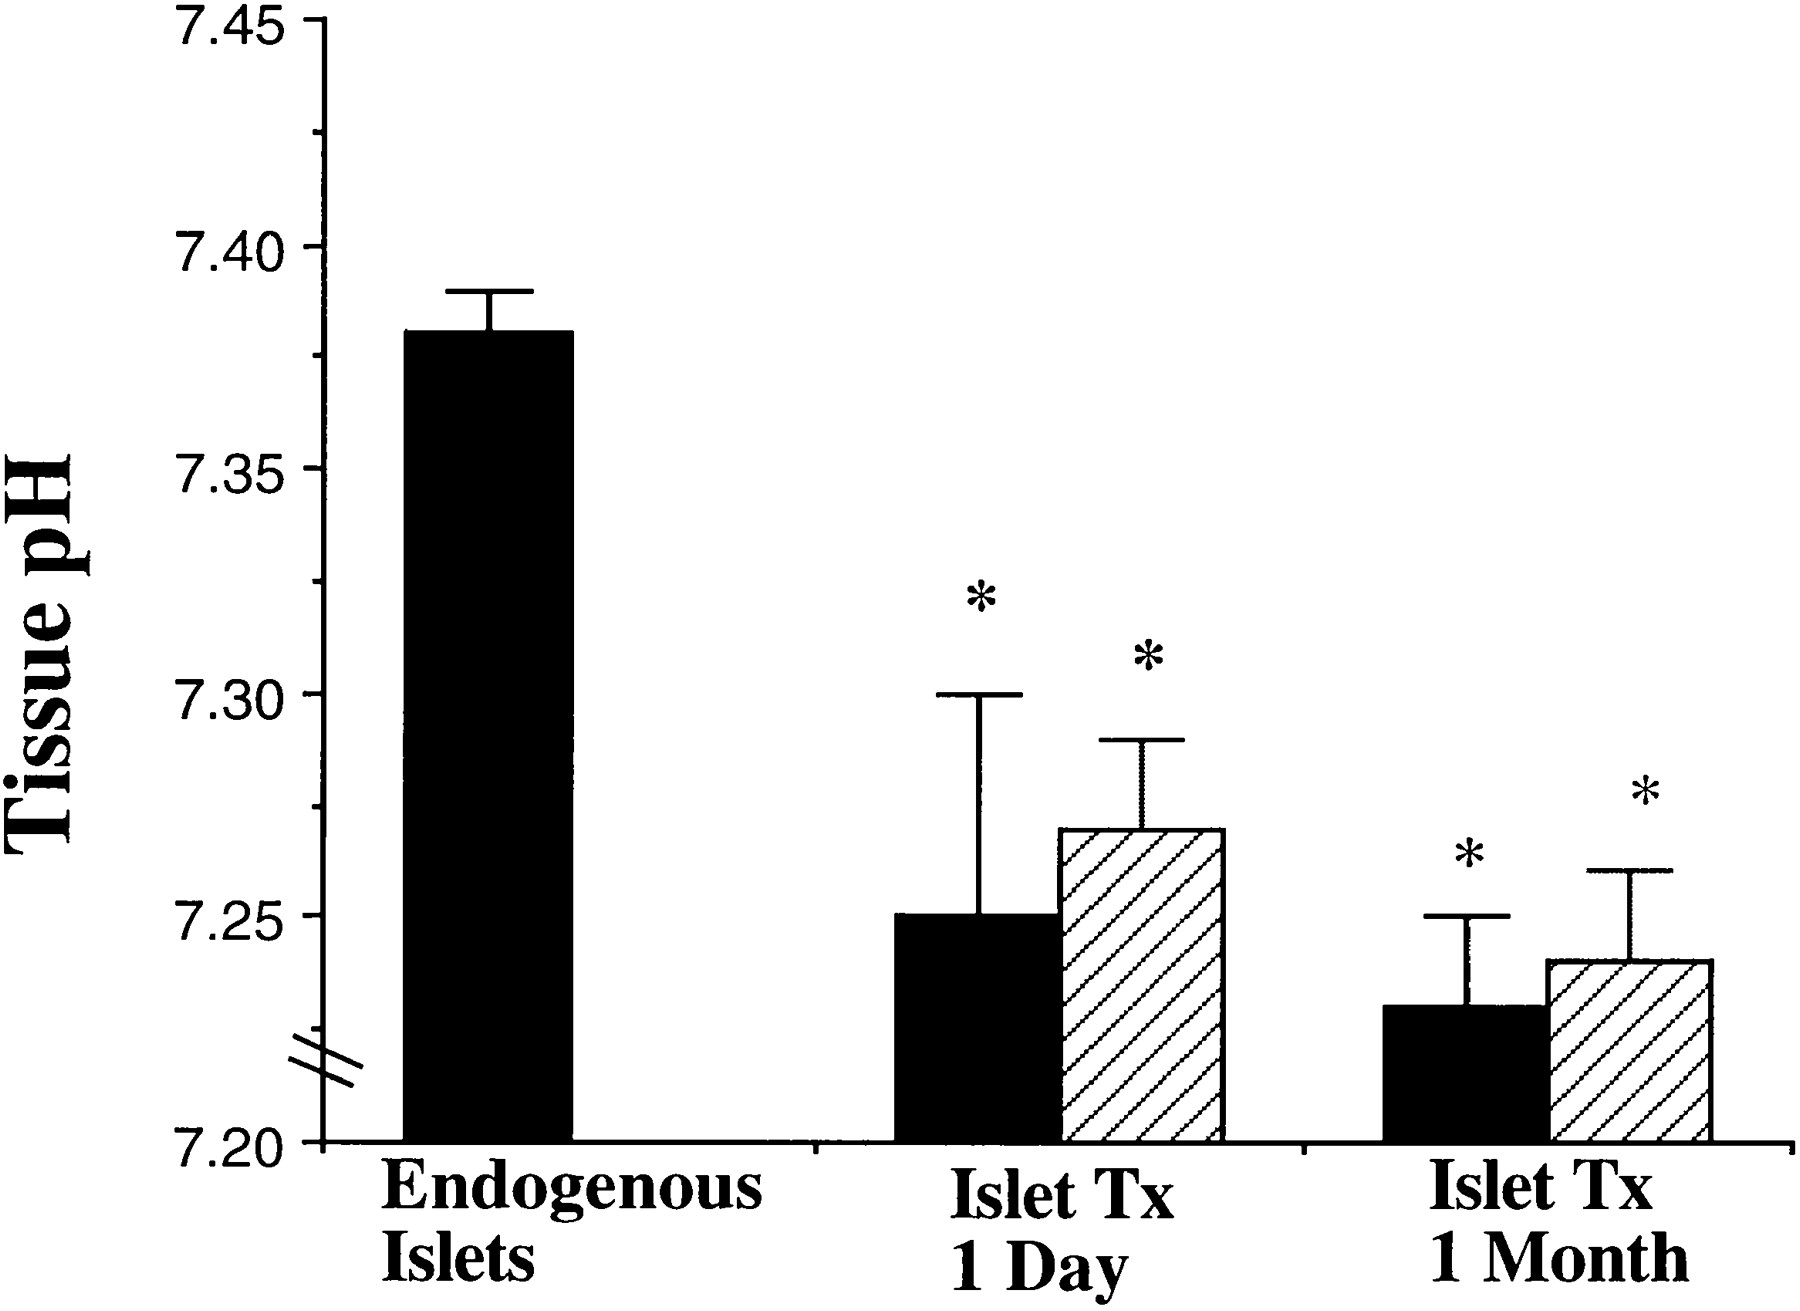
Is there any efficient way to draw broken axis graph in SAS?
Just as follow:

- Mark as New
- Bookmark
- Subscribe
- Mute
- RSS Feed
- Permalink
- Report Inappropriate Content
With SAS 9.4M1, you can request a broken axis for one axis at a time. Here is a blog article I wrote on this topic: Broken Axis - Graphically Speaking. All you have to do is provide the axis ranges you want to retain.
If you don't have SAS 9.4M1, you can consider some of the techniques I discuss in this article.:
- Mark as New
- Bookmark
- Subscribe
- Mute
- RSS Feed
- Permalink
- Report Inappropriate Content
Thanks Sanjay.
Graphically Speaking is a very nice blog, I have learn a lot from it .
For broken axis with double slash, like this: "// ", drawtext statement in PROC Template would be better.
Here is an example:
proc template;
define statgraph sgdesign;
dynamic _SEX _HEIGHT;
begingraph;
entrytitle halign=center 'Height by gender';
entryfootnote halign=left 'Broken axis demo';
layout lattice / rowdatarange=data columndatarange=data rowgutter=10 columngutter=10;
layout overlay /
yaxisopts=( type=linear
offsetmin=0.0
griddisplay=on
linearopts=( viewmin=0.0
viewmax=80.0
minorgrid=OFF
minorticks=OFF
tickvaluepriority=TRUE
tickvalueformat=BEST6.
tickvaluelist=(40.0 50.0 60.0 70.0 80.0)
tickdisplaylist=("0" "50" "60" "70" "80")
)
);
boxplot x=_SEX y=_HEIGHT / name='box' groupdisplay=Cluster;
drawrectangle x=58 y=128 width=4 height=4 /
display=all outlineattrs=(color=white) fillattrs=(color=white)
transparency=0 drawspace=graphpixel anchor=left;
drawtext textattrs=(size=12pt) "/" / x=55 y=138 rotate=-45
drawspace=graphpixel anchor=left border=false TRANSPARENCY=0;
drawtext textattrs=(size=12pt) "/" / x=55 y=120 rotate=-45
drawspace=graphpixel anchor=left border=false TRANSPARENCY=0;
endlayout;
endlayout;
endgraph;
end;
run;
proc sgrender data=SASHELP.CLASS template=sgdesign;
dynamic _SEX="SEX" _HEIGHT="HEIGHT";
run;

It seems that you'll come to China on September 4.
Hope to see you!
- Mark as New
- Bookmark
- Subscribe
- Mute
- RSS Feed
- Permalink
- Report Inappropriate Content
The benefit of this graph is not clear to me. There is no data below the break. Why is this better than just a Y axis that starts at 45?
- Mark as New
- Bookmark
- Subscribe
- Mute
- RSS Feed
- Permalink
- Report Inappropriate Content
Generally, Y axis starts from non –zero is not suggested, especially for bar chart. Because it often brings us an illusion vision.
.jpg")
Catch up on SAS Innovate 2026
Nearly 200 sessions are now available on demand with the SAS Innovate Digital Pass.
Explore Now →Learn how use the CAT functions in SAS to join values from multiple variables into a single value.

Find more tutorials on the SAS Users YouTube channel.
SAS Training: Just a Click Away
Ready to level-up your skills? Choose your own adventure.
-
4 replies
-
03-21-2014 10:18 AM
-
5656 views
-
0 likes
-
2 in conversation
-
