- Home
- /
- Programming
- /
- Graphics
- /
- How to explode slice on pie chart using using GTL?
- RSS Feed
- Mark Topic as New
- Mark Topic as Read
- Float this Topic for Current User
- Bookmark
- Subscribe
- Mute
- Printer Friendly Page

- Mark as New
- Bookmark
- Subscribe
- Mute
- RSS Feed
- Permalink
- Report Inappropriate Content
Hello All,
I have following code,
DATA usedata;
INPUT slicenm $ 1-8 val;
DATALINES;
Slice A 4.5
Slice B 5.8
Slice C 7.2;
RUN;
PROC TEMPLATE;
DEFINE statgraph piechart;
DYNAMIC _name _value;
BEGINGRAPH;
LAYOUT LATTICE;
LAYOUT REGION;
piechart category=_name response=_value / dataskin=sheen datalabellocation=inside;
ENDLAYOUT;
ENDLAYOUT;
ENDGRAPH;
END;
RUN;
PROC SGRENDER DATA=usedata TEMPLATE=piechart;
DYNAMIC _name="slicenm" _value="val";
RUN;
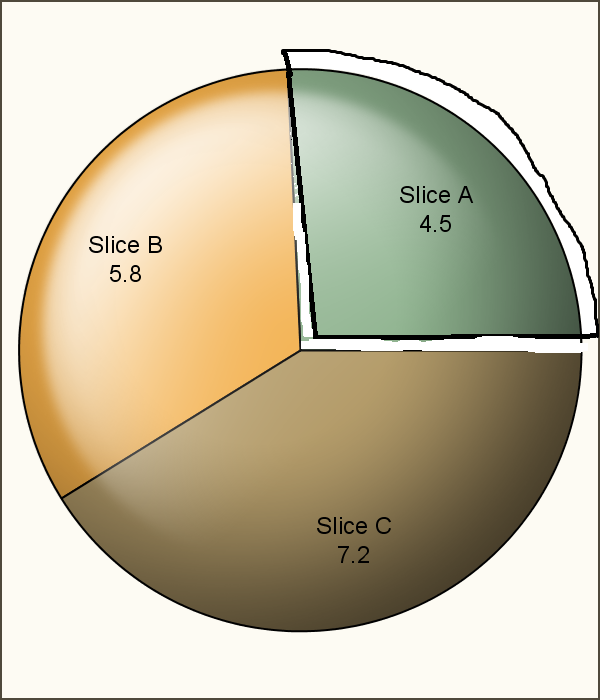
How can I explode specific slice on piechart using GTL? Can you please help me?
My expected output is like following:
Accepted Solutions

- Mark as New
- Bookmark
- Subscribe
- Mute
- RSS Feed
- Permalink
- Report Inappropriate Content
There is no built-in easy way to explode a slice in GTL. I suggest using PROC GCHART, with the PIE statement and EXPLODE option.
- Mark as New
- Bookmark
- Subscribe
- Mute
- RSS Feed
- Permalink
- Report Inappropriate Content
There is no built-in easy way to explode a slice in GTL. I suggest using PROC GCHART, with the PIE statement and EXPLODE option.
- Mark as New
- Bookmark
- Subscribe
- Mute
- RSS Feed
- Permalink
- Report Inappropriate Content
Thanks Sanjay, your answer makes me clear about this option in GTL as I thought earlier there might have way in GTL to do it which I could not able to find out. I did this as following way based on your suggestion,
DATA usedata;
INPUT slicenm $ 1-8 val;
DATALINES;
Slice A 4.5
Slice B 5.8
Slice C 7.2
;
RUN;
GOPTIONS DEVICE=png;
PROC GCHART DATA=usedata;
PIE slicenm / TYPE=SUM SUMVAR=val
EXPLODE="Slice A" ANGLE=0 ASCENDING NOHEADING
VALUE=inside SLICE=outside;
RUN;
QUIT;
Thanks for your suggestion also.
.jpg")
Catch up on SAS Innovate 2026
Nearly 200 sessions are now available on demand in the Innovate Hub.
Watch Now →Learn how use the CAT functions in SAS to join values from multiple variables into a single value.

Find more tutorials on the SAS Users YouTube channel.
SAS Training: Just a Click Away
Ready to level-up your skills? Choose your own adventure.
-
2 replies
-
05-13-2015 04:43 AM
-
3815 views
-
1 like
-
2 in conversation
-
