- Home
- /
- Programming
- /
- Graphics
- /
- How to combine bar chart and dot plot?
- RSS Feed
- Mark Topic as New
- Mark Topic as Read
- Float this Topic for Current User
- Bookmark
- Subscribe
- Mute
- Printer Friendly Page

- Mark as New
- Bookmark
- Subscribe
- Mute
- RSS Feed
- Permalink
- Report Inappropriate Content
Dear all,
How can I combine dot plot and bar chart? I've tried the following code:
data have;
input id $1. bar dot1 dot2;
datalines;
a 10 8 7
b 15 18 3
c 5 20 1
d -5 8 2
;
run;
proc sgplot data=have;
vbar id/response=bar;
dot id/response=dot1;
dot id/response=dot2 ;
run;
but got an:
ERROR: All overlays must have the same orientation.
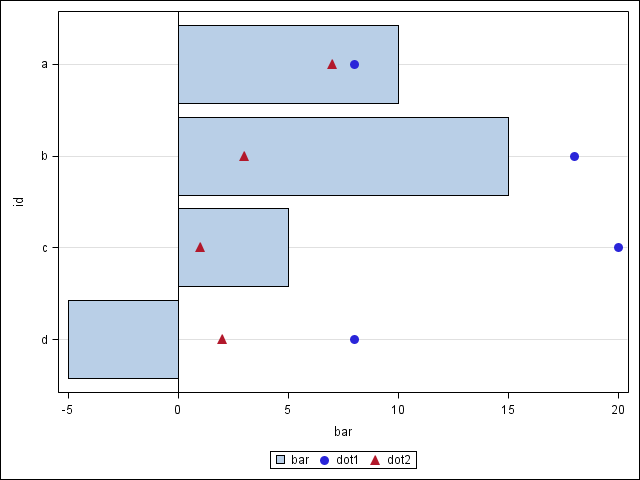
I would like to obtain something similar to the attached graph.
Thanks for help

Accepted Solutions

- Mark as New
- Bookmark
- Subscribe
- Mute
- RSS Feed
- Permalink
- Report Inappropriate Content
Hello,
In SGPLOT, you can only use dotplot with horizontal categorization plot statements. In your code you are trying to overlay a vertical plot with a horizontal plot and that is why you get that error.
You can use GTL to achieve what you want. Please try this code below:
proc template;
define statgraph barwithdot;
begingraph;
layout overlay;
barchart x=id y=bar / orient = vertical;
scatterplot x=id y=dot1 / markerattrs=(color=red symbol=squarefilled);
scatterplot x=id y=dot2 / markerattrs=(color=green symbol=trianglefilled);
endlayout;
endgraph;
end;
run;
proc sgrender data = have template = barwithdot;
run;
Thank you.
- Mark as New
- Bookmark
- Subscribe
- Mute
- RSS Feed
- Permalink
- Report Inappropriate Content
Thanks a lot djrisks. It works fine.
Best
- Mark as New
- Bookmark
- Subscribe
- Mute
- RSS Feed
- Permalink
- Report Inappropriate Content
You're welcome 🙂

- Mark as New
- Bookmark
- Subscribe
- Mute
- RSS Feed
- Permalink
- Report Inappropriate Content
The SGPLOT DOT plot is horizontally oriented. So, you could use an HBAR statement instead.
proc sgplot data=have;
hbar id/response=bar nostatlabel;
dot id/response=dot1 nostatlabel markerattrs=graphdata1(symbol=circlefilled size=10);
dot id/response=dot2 nostatlabel markerattrs=graphdata2(symbol=trianglefilled size=10);
run;
.jpg")
Catch up on SAS Innovate 2026
Nearly 200 sessions are now available on demand with the SAS Innovate Digital Pass.
Explore Now →Learn how use the CAT functions in SAS to join values from multiple variables into a single value.

Find more tutorials on the SAS Users YouTube channel.
SAS Training: Just a Click Away
Ready to level-up your skills? Choose your own adventure.
-
4 replies
-
06-15-2015 07:30 AM
-
9086 views
-
4 likes
-
3 in conversation
-
