- Home
- /
- Programming
- /
- Graphics
- /
- Help with legend
- RSS Feed
- Mark Topic as New
- Mark Topic as Read
- Float this Topic for Current User
- Bookmark
- Subscribe
- Mute
- Printer Friendly Page
- Mark as New
- Bookmark
- Subscribe
- Mute
- RSS Feed
- Permalink
- Report Inappropriate Content
If I fill some area on a line graph (that is using annotate dataset, I create a box in some area of the graph and color the box with say blue ).
Now how do I create a legend value of this color?? (the line graph will already be having a legend value associated with it for say 'amount' variable or any statistic variable.)... so how do I add the above color as a legend value to the existing default legend..???
Accepted Solutions
- Mark as New
- Bookmark
- Subscribe
- Mute
- RSS Feed
- Permalink
- Report Inappropriate Content
In that case, you could use the '1' coordinate system (such that you can specify x/y coordinates in the range of 0-100% of the area inside the axes). Here is the code that draws the orange area that way:
hsys='3'; when='b';
function = 'move'; xsys='2'; x=2008; ysys='1'; y=0; output;
function="bar"; xsys='1'; x=100; ysys='1'; y=100;
color="orange"; line=1; style="solid"; output;
- Mark as New
- Bookmark
- Subscribe
- Mute
- RSS Feed
- Permalink
- Report Inappropriate Content
Do we have any experts to answer this question? Any suggestions will be highly appreciative...![]()
- Mark as New
- Bookmark
- Subscribe
- Mute
- RSS Feed
- Permalink
- Report Inappropriate Content
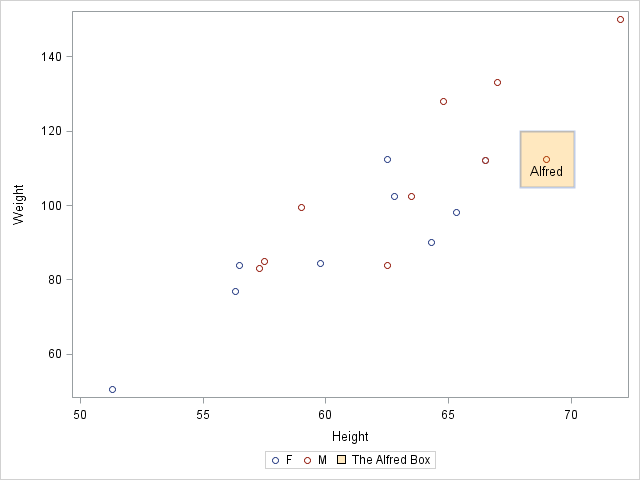
Here is how you can do it using the Graph Template Language (GTL) in SAS 9.3:
proc template;
define statgraph plot;
begingraph / drawspace=datavalue;
legenditem type=fill name="box" / label="The Alfred Box" fillattrs=(color=orange transparency=0.75);
layout overlay;
  scatterplot y=weight x=height / group=sex name="scatter";
  drawrectangle x=69 y=112.5 width=10 height=15 /
               display=all fillattrs=(color=orange)
               transparency=0.75;
  drawtext "Alfred" / x=69 y=112  anchor=top;
  discretelegend "scatter" "box";
endlayout;
endgraph;
end;
run;

proc sgrender data=sashelp.class template=plot; run;

- Mark as New
- Bookmark
- Subscribe
- Mute
- RSS Feed
- Permalink
- Report Inappropriate Content
Thanks DanH for your reply and providing a solution.
I am actually using SAS9.2. Running your code gave error at drawspace and legenditem............
Still I tried running the below simple proc template via EG to check step by step.. but got error:
ERROR: Insufficient authorization to access ...path../SASApp/SGRender1.png.
proc template;
define statgraph histogram;
begingraph;
layout overlay;
histogram weight;
endlayout;
endgraph;
end;
run;
ods graphics / width=450px;
ods listing;
proc sgrender data=sashelp.class
template=histogram;
run;
Then I tried running same via unix prompt and got error:
ERROR: The connection to the X display server could not be made....
But when running normal gplot and gchart procedures its not giving X display error....
- Mark as New
- Bookmark
- Subscribe
- Mute
- RSS Feed
- Permalink
- Report Inappropriate Content
Do you have an X-server running somewhere that you could set your 'DISPLAY' to?
(Maybe an XMing or Hummingbird eXceed X-server running somewhere?)
Such as: export DISPLAY=somemachine.foo.unx:0.0
In the past, SAS/Graph running on Unix needed an X-display to query what fonts were available.
After SAS version 9.2, I don't think SAS/Graph needs an X-display anymore, but maybe the ODS Graphics (such as proc sgrender) need it(?) - I'm not 100% sure on that one, but it's probably worth a try.
- Mark as New
- Bookmark
- Subscribe
- Mute
- RSS Feed
- Permalink
- Report Inappropriate Content
ODS Graphics does not need a display to run. When you say, "via unix prompt", are you running in batch, or with -nodms?
- Mark as New
- Bookmark
- Subscribe
- Mute
- RSS Feed
- Permalink
- Report Inappropriate Content
On unix prompt ; I just type > sas program_name.sas
But when I run any other sas program that has GPLOT & GCHART (via unix prompt or EG), it runs fine without any issues.
Before my previous reply , I had tried export display=host:port but that wasn't working...
- Mark as New
- Bookmark
- Subscribe
- Mute
- RSS Feed
- Permalink
- Report Inappropriate Content
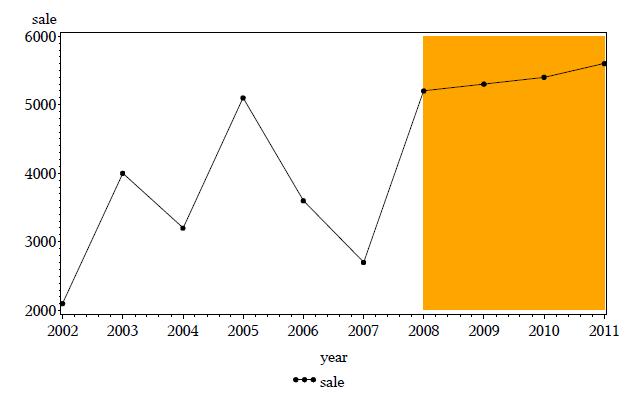
Below is the code that I can run in SAS9.2 and get the output. Is it possible to do some changes /addition to this code and get a legend displayed for the orange color in the graph.
I mean there must be some trick to fool SAS.. ![]()
data carea;
LENGTH FUNCTION $8 STYLE $8 COLOR $8;
retain xsys ysys "2" hsys "3" when "b";
function = 'move'; x=2008; y=2000; output;
function="bar"; x=2011; y=6000; color="orange"; line=1; style="simplex"; output;
run;
symbol v=dot i=join;
legend1 label=none;
proc gplot data=sales;
plot (sale) * year/ legend=legend1 annotate=carea;
run;
quit;
- Mark as New
- Bookmark
- Subscribe
- Mute
- RSS Feed
- Permalink
- Report Inappropriate Content
Here is the output :

- Mark as New
- Bookmark
- Subscribe
- Mute
- RSS Feed
- Permalink
- Report Inappropriate Content
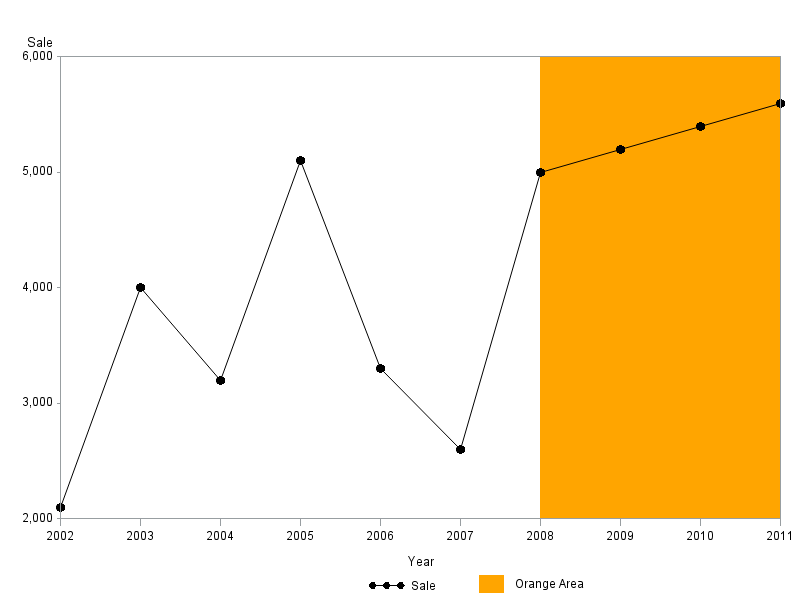
The following example shows how to manually annotate a legend for the orange color:
%let name=anno_legend;
filename odsout '.';
data sales;
format Sale comma10.0;
input Year Sale;
datalines;
2002 2100
2003 4000
2004 3200
2005 5100
2006 3300
2007 2600
2008 5000
2009 5200
2010 5400
2011 5600
;
run;
data color_area;
LENGTH FUNCTION $8 STYLE $8 COLOR $8;
xsys='2'; ysys='2'; hsys='3'; when='b';
function = 'move'; x=2008; y=2000; output;
function="bar"; x=2011; y=6000;
color="orange"; line=1; style="solid"; output;
/* Draw a custom legend with annotate */
xsys='3'; ysys='3'; hsys='3'; when='a';
function = 'move'; x=60; y=1; output;
function="bar"; x=x+3; y=y+3;
color="orange"; line=1; style="solid"; output;
function="label"; color='black'; position='6'; x=64.5; y=3;
text="Orange Area"; output;
run;
goptions device=png;
ODS LISTING CLOSE;
ODS HTML path=odsout body="&name..htm" style=htmlblue;
symbol1 value=dot height=1.5 interpol=join color=black;
legend1 label=none;
axis1 minor=none offset=(0,0);
axis2 minor=none offset=(0,0);
proc gplot data=sales;
plot sale*year=1 /
legend=legend1 annotate=color_area
vaxis=axis1 haxis=axis2
des='' name="&name";
run;
quit;
ODS HTML CLOSE;
ODS LISTING;
- Mark as New
- Bookmark
- Subscribe
- Mute
- RSS Feed
- Permalink
- Report Inappropriate Content
Here is the output:

- Mark as New
- Bookmark
- Subscribe
- Mute
- RSS Feed
- Permalink
- Report Inappropriate Content
Thanks Robert ! This works...
The only thing is if footnotes are added or if the height of graph area changes, then adjustment will have to be made to the co-ordinates of this legend...right? Other than that this looks great!!
One small question..
In above example to draw a bar , we start from x=2008, y=2000 till x1=2011 , y1=6000.
Suppose if the data keeps on changing then we dont know what exactly will be thevalue for y,x1,y1.
But we know only x (i.e., 2008...from where the fill area should start ) and that starting from 2008 till the maximum point on X-axis all of the area needs to be filled with a color. Is it possible to do something like .... Move to point 2008 on X-axis; then draw a straight line till the top of the plot area; then fill all of the area on the right side of this straight line?
- Mark as New
- Bookmark
- Subscribe
- Mute
- RSS Feed
- Permalink
- Report Inappropriate Content
In that case, you could use the '1' coordinate system (such that you can specify x/y coordinates in the range of 0-100% of the area inside the axes). Here is the code that draws the orange area that way:
hsys='3'; when='b';
function = 'move'; xsys='2'; x=2008; ysys='1'; y=0; output;
function="bar"; xsys='1'; x=100; ysys='1'; y=100;
color="orange"; line=1; style="solid"; output;
- Mark as New
- Bookmark
- Subscribe
- Mute
- RSS Feed
- Permalink
- Report Inappropriate Content
Excellent! this works.... Thanks Robert, u r great!!
April 27 – 30 | Gaylord Texan | Grapevine, Texas
Registration is open
Walk in ready to learn. Walk out ready to deliver. This is the data and AI conference you can't afford to miss.
Register now and save with the early bird rate—just $795!
Learn how use the CAT functions in SAS to join values from multiple variables into a single value.
Find more tutorials on the SAS Users YouTube channel.
SAS Training: Just a Click Away
Ready to level-up your skills? Choose your own adventure.


