- Home
- /
- Programming
- /
- Graphics
- /
- Displaying 0 on log axis
- RSS Feed
- Mark Topic as New
- Mark Topic as Read
- Float this Topic for Current User
- Bookmark
- Subscribe
- Mute
- Printer Friendly Page
- Mark as New
- Bookmark
- Subscribe
- Mute
- RSS Feed
- Permalink
- Report Inappropriate Content
I want to display "0" as a tick on y-axis. The y-axis in my plot is log axis.
The ticks I have currently are 1E1, 1E2, etc. I am using SAS 9.4M2.
Is there any way to display 0 tick on the y-axis ?
- Mark as New
- Bookmark
- Subscribe
- Mute
- RSS Feed
- Permalink
- Report Inappropriate Content
You need to provide a bit more detail of the code generating the graph as there may be different options available depending on your approach or procedure used.
- Mark as New
- Bookmark
- Subscribe
- Mute
- RSS Feed
- Permalink
- Report Inappropriate Content
You can't display 0 on a log-scale axis because log(0) is undefined.
You can display 1E-6, which is 6 units to the left of 1.
You can display 1E-10, which is 10 units to the left of 1.
You can display 1E-16, which is 16 units to the left of 1 and is about the limit of many numerical computations.
- Mark as New
- Bookmark
- Subscribe
- Mute
- RSS Feed
- Permalink
- Report Inappropriate Content
Thanks.
Does format works on log axis in 9.4M2 ?
- Mark as New
- Bookmark
- Subscribe
- Mute
- RSS Feed
- Permalink
- Report Inappropriate Content
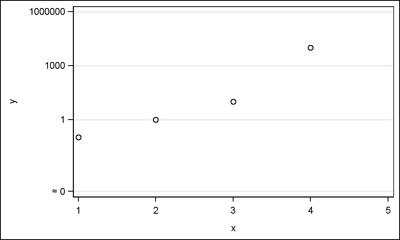
First, let me say I agree with Rick that one should not display a '0' on a log axis. Having said that, if you really want to do that, you can use a format to display the lowest value as '0' as shown below. Or, with SAS 9.40M3, you can use special Unicode values in your format to display the smallest value as "approximately" 0 🙂
data log;
input x y;
datalines;
1 0.1
2 1
3 10
4 10000
5 10000000
;
run;
proc format;
value logzero
0.0001="(*ESC*){unicode '2248'x} 0"
1='1'
1000='1000'
1000000='1000000'
;
run;
ods html close;
ods listing gpath='C:\Work\SASUser' image_dpi=200;
ods graphics / reset width=5in height=3in imagename='LogZero';
proc sgplot data=log;
format y logzero.;
scatter x=x y=y;
yaxis type=log logbase=10 min=0.0001 grid
values=(0.0001 1 1000 1000000) ;
run;
- Mark as New
- Bookmark
- Subscribe
- Mute
- RSS Feed
- Permalink
- Report Inappropriate Content
Thank you all for all the answers. I ended up doing the log transformation first and then using linear scale.
I used format to display values I needed.
- Mark as New
- Bookmark
- Subscribe
- Mute
- RSS Feed
- Permalink
- Report Inappropriate Content
Just to warn you, if you intend to show this graph to someone else, they might notice that it makes no sense.
- Mark as New
- Bookmark
- Subscribe
- Mute
- RSS Feed
- Permalink
- Report Inappropriate Content
Thanks Rick. Not using log..it is linear.
April 27 – 30 | Gaylord Texan | Grapevine, Texas
Registration is open
Walk in ready to learn. Walk out ready to deliver. This is the data and AI conference you can't afford to miss.
Register now and save with the early bird rate—just $795!
Learn how use the CAT functions in SAS to join values from multiple variables into a single value.
Find more tutorials on the SAS Users YouTube channel.
SAS Training: Just a Click Away
Ready to level-up your skills? Choose your own adventure.


