- Home
- /
- Programming
- /
- Graphics
- /
- Different colors in a scatterplot
- RSS Feed
- Mark Topic as New
- Mark Topic as Read
- Float this Topic for Current User
- Bookmark
- Subscribe
- Mute
- Printer Friendly Page

- Mark as New
- Bookmark
- Subscribe
- Mute
- RSS Feed
- Permalink
- Report Inappropriate Content
I'm working on creating a scatter plot that evaluates different offices on a shared score. There are 16 office and I would like to display all providers and highlight a single office at a time in a different color. For example, I would like to highlight the providers at office 1 in red and leave the other providers at the rest of the offices in blue. Taking this one step further, I would also like to highlight a single provider in the highlighted office in another color. So provider 1 in office 1 would be yellow, the other providers at office 1 would be red and all others would be blue. Is this possible to do using proc sgscatter?

- Mark as New
- Bookmark
- Subscribe
- Mute
- RSS Feed
- Permalink
- Report Inappropriate Content
Yes its possible, I generally go with SGPLOT instead, but doubt it matters.
So at the end you'll want 16 plots?
- Mark as New
- Bookmark
- Subscribe
- Mute
- RSS Feed
- Permalink
- Report Inappropriate Content
I think I will export them to a PDF and have 16 different graphs. I may have as many as 80 though if I single out providers among offices.
- Mark as New
- Bookmark
- Subscribe
- Mute
- RSS Feed
- Permalink
- Report Inappropriate Content
Assuming you'd still want to differentiate other providers out by shape perhaps? Or just a single colour for all remaining providers?
Can you post sample data?
- Mark as New
- Bookmark
- Subscribe
- Mute
- RSS Feed
- Permalink
- Report Inappropriate Content
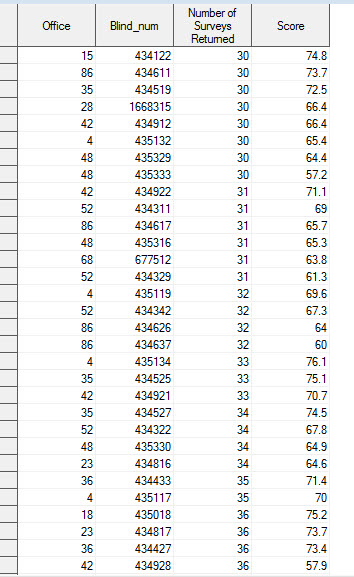
A single color will do. Here is some sample data:

- Mark as New
- Bookmark
- Subscribe
- Mute
- RSS Feed
- Permalink
- Report Inappropriate Content
Better to go with SGPLOT procedure with SCATTER statement. If you have SAS 9.3, then you can use a DAttrMap to get specific colors.
.jpg")
Catch up on SAS Innovate 2026
Nearly 200 sessions are now available on demand in the Innovate Hub.
Watch Now →Learn how use the CAT functions in SAS to join values from multiple variables into a single value.

Find more tutorials on the SAS Users YouTube channel.
SAS Training: Just a Click Away
Ready to level-up your skills? Choose your own adventure.
-
5 replies
-
02-21-2014 03:55 PM
-
4088 views
-
6 likes
-
3 in conversation
-
