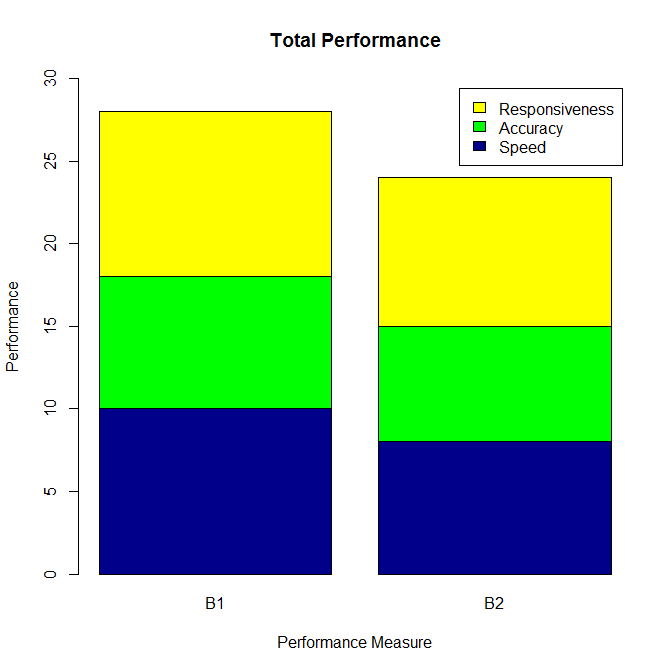
I'd like to offer another solution. If you have SAS IML and have downloaded and installed the freely available R statistical package, then as of SAS 9.2, you should now be able to send your SAS datasets directly to R, graph your data in R, and return to SAS seamlessly all from within the SAS editor. Depending on what you are trying to do, the graphics quality in R can sometimes be superior to that of SAS, in my opinion. Here's the code and resulting graph using this method with R 2.15.2:
data work.temp;
input Building $2. Speed Accuracy Responsiveness Total;
datalines;
B1 10 8 10 28
B2 8 7 9 24
;
run;
proc iml;
run ExportDataSetToR("work.temp", "temp" );
submit / R;
plotmatrix<-t(temp[c(-1, -5)])
colnames(plotmatrix)<-c("B1", "B2")
barplot(plotmatrix,
main="Total Performance",
xlab="Performance Measure",
ylab="Performance",
col=c("darkblue", "green", "yellow"),
ylim=c(0, 30),
legend=rownames(plotmatrix))
dev.copy(png,filename="c://myplot.png")
dev.off();
endsubmit;
run;
quit;