- Home
- /
- Programming
- /
- Graphics
- /
- Re: Can Graph produce a pglot and a gchart within such a common file?
- RSS Feed
- Mark Topic as New
- Mark Topic as Read
- Float this Topic for Current User
- Bookmark
- Subscribe
- Mute
- Printer Friendly Page

- Mark as New
- Bookmark
- Subscribe
- Mute
- RSS Feed
- Permalink
- Report Inappropriate Content
Dear All,
With Graph tools, we can produce a Gplot and a Chart seperately in 2 png files, my quesition is how can we combines these Gplot and Chart together within one file?
After explored the Help documentation and Graphics Samples Output Gallery, it seems that I need to do some work on modification of related templates, is it?
So far, this looks a bit complex for me, I come here and see if anyone can provide help, if any advice or addtional sample codes would be very much appreciated, thank you for your time in advance!
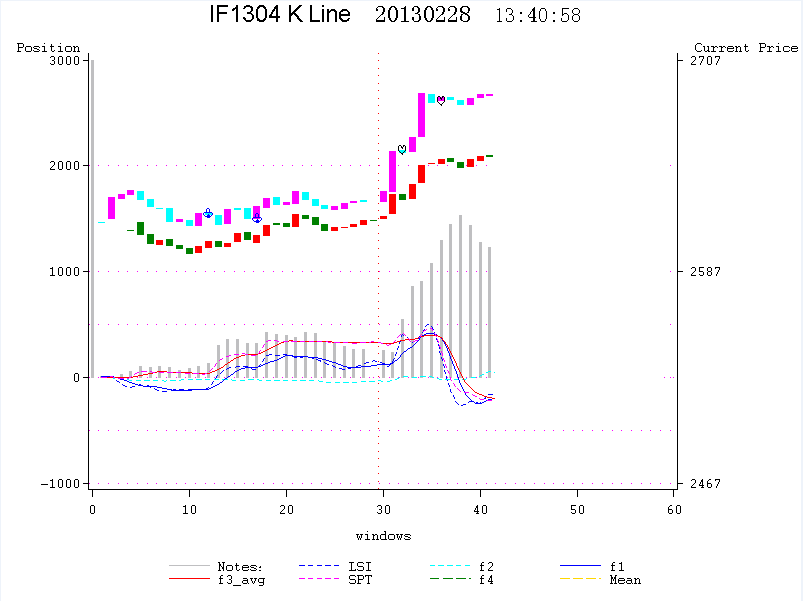
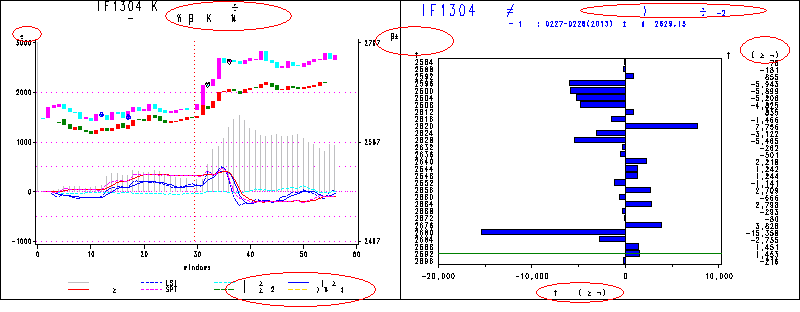
1. a Gplot is as such:
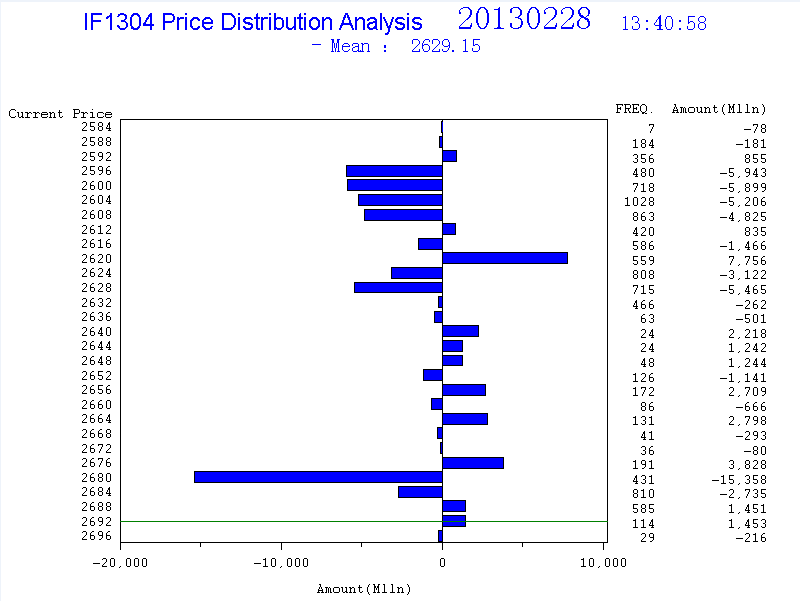
2. another Chart is as such:
After combination, the target file should be looks like below(Note: these 2 should connected with
a shared Y axis, i.e. the field of 'Current Price' here):
Sincerely,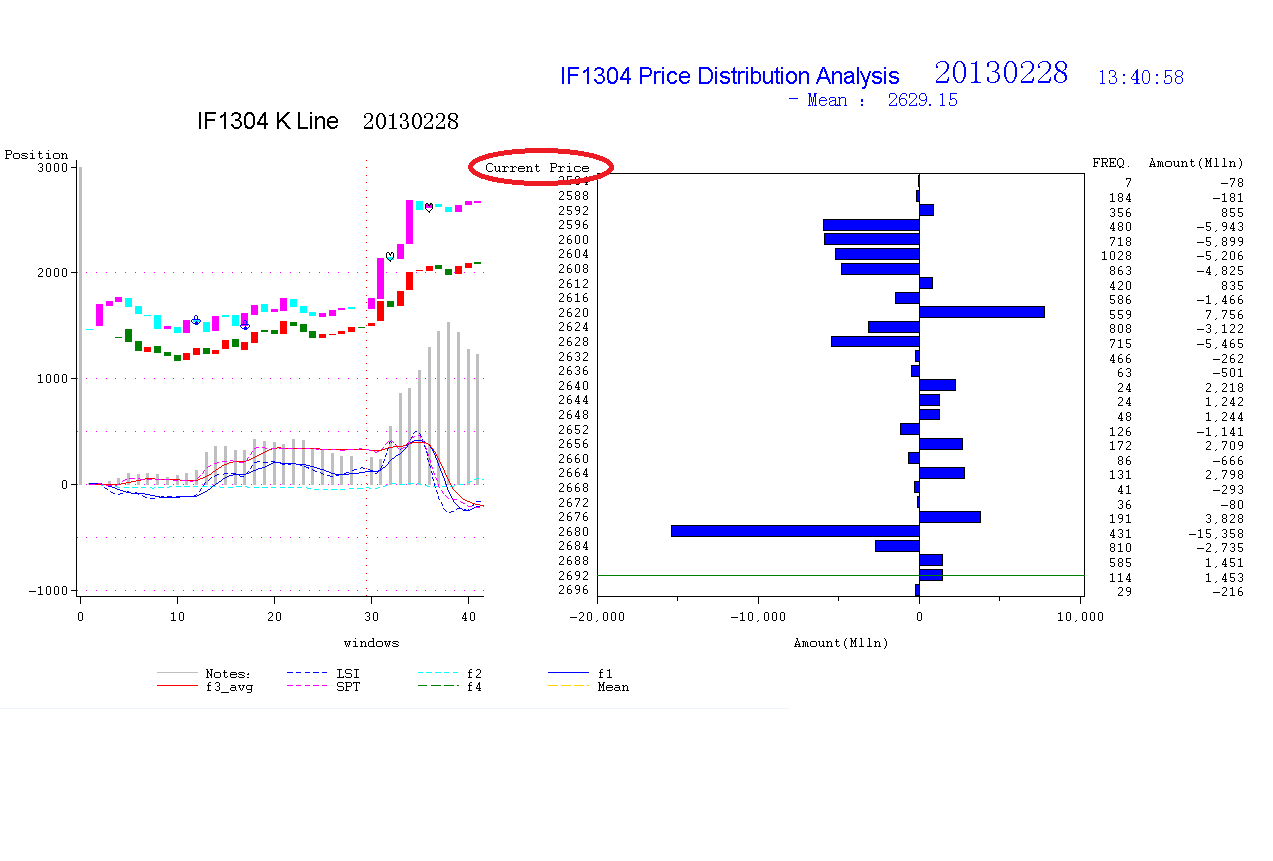
Yuanbin
Accepted Solutions

- Mark as New
- Bookmark
- Subscribe
- Mute
- RSS Feed
- Permalink
- Report Inappropriate Content
To get a gchart and a gplot to appear side-by-side in the same png file, you will want to use Proc Greplay.
You can either use one of the pre-defined greplay templates, or if those templates don't position the graphs exactly the way you want them, you can create a custom template.
- Mark as New
- Bookmark
- Subscribe
- Mute
- RSS Feed
- Permalink
- Report Inappropriate Content
Thank you very much, Robert! and I have got it, the good file was produced as below:
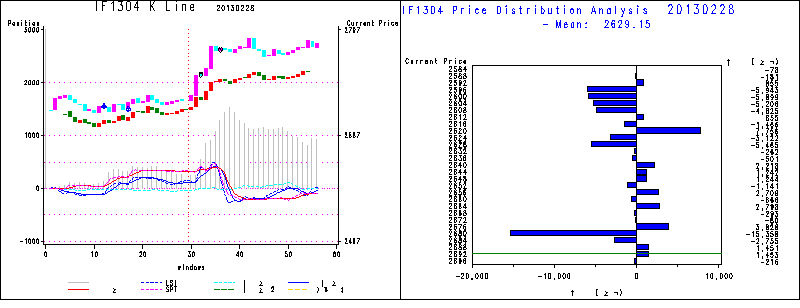
After I changed the fonts with Simplified Chinese charactors, the text was shown as such:
Actually, the first picture display correctly in a seperate file as below:
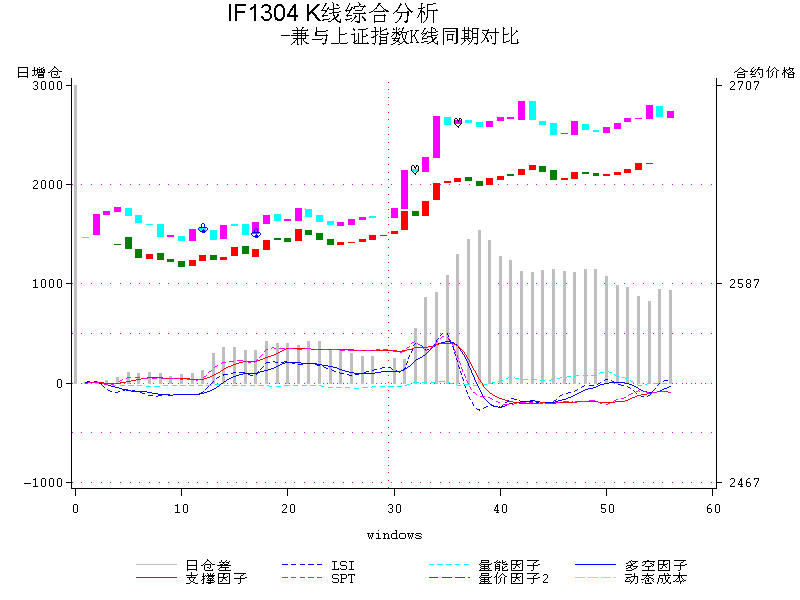
I'm wondering what's wrong when replay in a common file and how to fix this problem? Thanks much!
Yuanbin
- Mark as New
- Bookmark
- Subscribe
- Mute
- RSS Feed
- Permalink
- Report Inappropriate Content
(tracking this down in a different thread)
.jpg")
Catch up on SAS Innovate 2026
Nearly 200 sessions are now available on demand in the Innovate Hub.
Watch Now →Learn how use the CAT functions in SAS to join values from multiple variables into a single value.

Find more tutorials on the SAS Users YouTube channel.
SAS Training: Just a Click Away
Ready to level-up your skills? Choose your own adventure.
-
3 replies
-
03-15-2013 02:51 AM
-
2780 views
-
0 likes
-
2 in conversation
-
