- Home
- /
- Programming
- /
- Graphics
- /
- Bar outline in sgplot
- RSS Feed
- Mark Topic as New
- Mark Topic as Read
- Float this Topic for Current User
- Bookmark
- Subscribe
- Mute
- Printer Friendly Page
- Mark as New
- Bookmark
- Subscribe
- Mute
- RSS Feed
- Permalink
- Report Inappropriate Content
Hello,
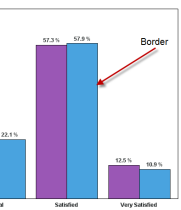
Is there a way to control the bar outline appearance in proc sgplot/vbar?
Thanks
Abe
Accepted Solutions
- Mark as New
- Bookmark
- Subscribe
- Mute
- RSS Feed
- Permalink
- Report Inappropriate Content
Use NOOUTLINE option on VBAR. However, if using data skins, you will always get outline.
- Mark as New
- Bookmark
- Subscribe
- Mute
- RSS Feed
- Permalink
- Report Inappropriate Content
Yes
- Mark as New
- Bookmark
- Subscribe
- Mute
- RSS Feed
- Permalink
- Report Inappropriate Content
Thanks but could you give some hint?
Abe
- Mark as New
- Bookmark
- Subscribe
- Mute
- RSS Feed
- Permalink
- Report Inappropriate Content
Abe,
your question is very vague and Reeza's answer is correct: yes, you can control the bar outline in proc sgplot/vbar...
so, there are a couple of websites that I find extremely helpful when dealing with graphs in SAS
http://blogs.sas.com/content/graphicallyspeaking/?s=vbar
and
Robert Allison's SAS/Graph Examples!
Good luck!
PS: here is a final link on how to ask a question on the forum:
- Mark as New
- Bookmark
- Subscribe
- Mute
- RSS Feed
- Permalink
- Report Inappropriate Content
Thanks for the very useful links but in all of them, the bars appeared outlined with a thin border line surrounding the bars which I want to get rid of

Thanks
Abe
- Mark as New
- Bookmark
- Subscribe
- Mute
- RSS Feed
- Permalink
- Report Inappropriate Content
Use NOOUTLINE option on VBAR. However, if using data skins, you will always get outline.
- Mark as New
- Bookmark
- Subscribe
- Mute
- RSS Feed
- Permalink
- Report Inappropriate Content
Many thanks! It works
Abe
April 27 – 30 | Gaylord Texan | Grapevine, Texas
Registration is open
Walk in ready to learn. Walk out ready to deliver. This is the data and AI conference you can't afford to miss.
Register now and save with the early bird rate—just $795!
Learn how use the CAT functions in SAS to join values from multiple variables into a single value.
Find more tutorials on the SAS Users YouTube channel.
SAS Training: Just a Click Away
Ready to level-up your skills? Choose your own adventure.


