- Home
- /
- Programming
- /
- Graphics
- /
- Bar outline in sgplot
- RSS Feed
- Mark Topic as New
- Mark Topic as Read
- Float this Topic for Current User
- Bookmark
- Subscribe
- Mute
- Printer Friendly Page

- Mark as New
- Bookmark
- Subscribe
- Mute
- RSS Feed
- Permalink
- Report Inappropriate Content
Hello,
Is there a way to control the bar outline appearance in proc sgplot/vbar?
Thanks
Abe
Accepted Solutions

- Mark as New
- Bookmark
- Subscribe
- Mute
- RSS Feed
- Permalink
- Report Inappropriate Content
Use NOOUTLINE option on VBAR. However, if using data skins, you will always get outline.

- Mark as New
- Bookmark
- Subscribe
- Mute
- RSS Feed
- Permalink
- Report Inappropriate Content
Yes
- Mark as New
- Bookmark
- Subscribe
- Mute
- RSS Feed
- Permalink
- Report Inappropriate Content
Thanks but could you give some hint?
Abe

- Mark as New
- Bookmark
- Subscribe
- Mute
- RSS Feed
- Permalink
- Report Inappropriate Content
Abe,
your question is very vague and Reeza's answer is correct: yes, you can control the bar outline in proc sgplot/vbar...
so, there are a couple of websites that I find extremely helpful when dealing with graphs in SAS
http://blogs.sas.com/content/graphicallyspeaking/?s=vbar
and
Robert Allison's SAS/Graph Examples!
Good luck!
PS: here is a final link on how to ask a question on the forum:
- Mark as New
- Bookmark
- Subscribe
- Mute
- RSS Feed
- Permalink
- Report Inappropriate Content
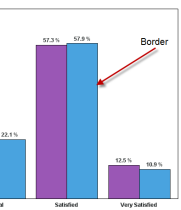
Thanks for the very useful links but in all of them, the bars appeared outlined with a thin border line surrounding the bars which I want to get rid of
Thanks
Abe
- Mark as New
- Bookmark
- Subscribe
- Mute
- RSS Feed
- Permalink
- Report Inappropriate Content
Use NOOUTLINE option on VBAR. However, if using data skins, you will always get outline.
- Mark as New
- Bookmark
- Subscribe
- Mute
- RSS Feed
- Permalink
- Report Inappropriate Content
Many thanks! It works
Abe
.jpg")
Catch up on SAS Innovate 2026
Nearly 200 sessions are now available on demand in the Innovate Hub.
Watch Now →Learn how use the CAT functions in SAS to join values from multiple variables into a single value.

Find more tutorials on the SAS Users YouTube channel.
SAS Training: Just a Click Away
Ready to level-up your skills? Choose your own adventure.
-
6 replies
-
06-19-2013 03:04 PM
-
8566 views
-
4 likes
-
4 in conversation
-
