- Home
- /
- Programming
- /
- Graphics
- /
- Re: Ascending Order of my Graph
- RSS Feed
- Mark Topic as New
- Mark Topic as Read
- Float this Topic for Current User
- Bookmark
- Subscribe
- Mute
- Printer Friendly Page

- Mark as New
- Bookmark
- Subscribe
- Mute
- RSS Feed
- Permalink
- Report Inappropriate Content
Hi,
I plotted a chart which is attached. But I'd like to know is there any way that I can plot in an ascending order of the BLUE portion of the graph. I want my chart to be in ascending order (blue color).
Help me.
Naresh


- Mark as New
- Bookmark
- Subscribe
- Mute
- RSS Feed
- Permalink
- Report Inappropriate Content
Is the graph part of the code available for posting? And, what version of SAS are you using?
- Mark as New
- Bookmark
- Subscribe
- Mute
- RSS Feed
- Permalink
- Report Inappropriate Content
proc gchart data=Multiplot;
vbar Client / sumvar = percent discrete inside = subpct
subgroup = cross;
run;
quit;
9.3 Version

- Mark as New
- Bookmark
- Subscribe
- Mute
- RSS Feed
- Permalink
- Report Inappropriate Content
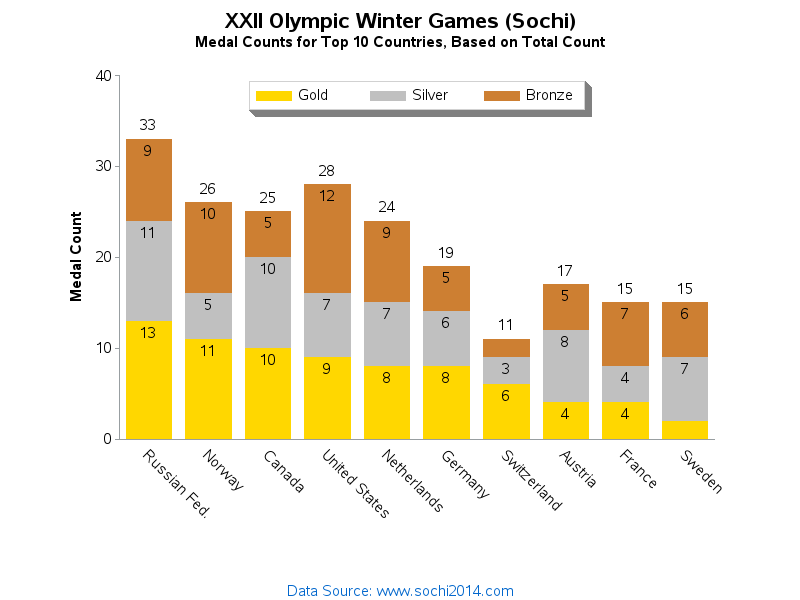
Here is an example where I sort the bars by 1 of the colored bar segments (in this case, the number of gold Olympic medals)...
http://robslink.com/SAS/democd70/sochi_olympics_2014.htm
http://robslink.com/SAS/democd70/sochi_olympics_2014_info.htm
I sort the data in the desired order, and then assign a 'bar_order' variable, and plot the bars by those numeric bar_order values. I then create a user-defined-format so the numeric bar-order values show up on the axis as the desired text (rather than their numeric value).
.jpg")
Catch up on SAS Innovate 2026
Nearly 200 sessions are now available on demand in the Innovate Hub.
Watch Now →Learn how use the CAT functions in SAS to join values from multiple variables into a single value.

Find more tutorials on the SAS Users YouTube channel.
SAS Training: Just a Click Away
Ready to level-up your skills? Choose your own adventure.
-
3 replies
-
09-23-2014 04:14 PM
-
2461 views
-
0 likes
-
3 in conversation
-
