- Home
- /
- Programming
- /
- Graphics
- /
- Any idea why this use of SPLITCHAR does not work?
- RSS Feed
- Mark Topic as New
- Mark Topic as Read
- Float this Topic for Current User
- Bookmark
- Subscribe
- Mute
- Printer Friendly Page

- Mark as New
- Bookmark
- Subscribe
- Mute
- RSS Feed
- Permalink
- Report Inappropriate Content
I am trying to get multi-line splits on values on tick marks on an axis in PROC SGPLOT in SAS 9.4 TS Level 1M1. I had assumed I could get this using SPLITCHAR, but I do not seem to get this to work. A minimal working example of my code is below and I attach a screenshot of my output.
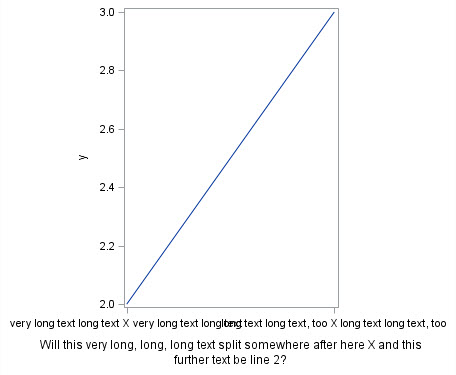
proc format;
value xf
1="very long text long text X very long text long text"
2="long text long text, too X long text long text, too";
run;
data test;
x=1; y=2;
output;
x=2; y=3;
output;
run;
ods graphics / width=12cm height=10cm;
proc sgplot data=test;
format x xf.;
label x="Will this very long, long, long text split somewhere after here X and this further text be line 2?";
xaxis splitchar="X" fitpolicy=splitalways values=(1,2);
series x=x y=y ;
run;

- Mark as New
- Bookmark
- Subscribe
- Mute
- RSS Feed
- Permalink
- Report Inappropriate Content
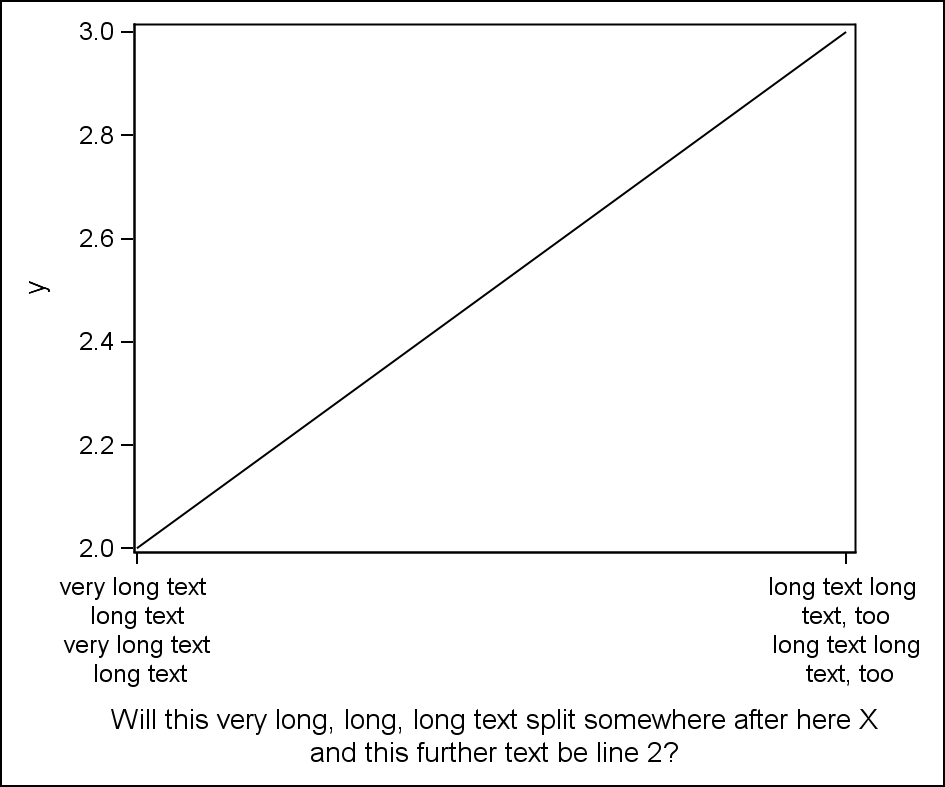
Tick value splitting works for DISCRETE axis, not in the case where the axis is actually numeric, but the values are formatted to strings. We will have to address that in next release.
It will work if you make the axis Discrete.

- Mark as New
- Bookmark
- Subscribe
- Mute
- RSS Feed
- Permalink
- Report Inappropriate Content
What about the case when the axis is actually numeric, but the values are formatted to strings? Is there any way to wrap the axis values text? I'd like to have '0D 00H 00M' in 3 lines. Is it possible?

- Mark as New
- Bookmark
- Subscribe
- Mute
- RSS Feed
- Permalink
- Report Inappropriate Content
For non-discrete axes, it can done using annotation. If you look at the first example on page 5 of my paper (see thelink below), you will see the techinque that can be applied to any axis (the example used a bar chart). It might be helpful to also see the previous example on pages 3-4 to give additional context. For now, the splitting policy works only for discrete axes (as Sanjay said); but, hopefully we can address this need in the future as well.
Thanks!
Dan
- Mark as New
- Bookmark
- Subscribe
- Mute
- RSS Feed
- Permalink
- Report Inappropriate Content
Thank you! Great article!
So it I'm plotting
series x = atptn1 y = aval2 / group = randno ;
where atptn1 is a numeric variable, as I understood correctly from your example I need to use anno like this:
data anno;
set test (keep=atpt) end=_last_;
length x1space $ 11 y1space $ 13 anchor $ 6;
rename atpt=atptn1;
retain function "text" x1space "datavalue" y1space "wallpercent" width 15
justify "center" y1 -1 anchor "top";
label=state;
output;
if (_last_) then do;
x1space = "wallpercent";
y1space = "graphpercent";
anchor="bottom";
x1=50;
y1=1;
output;
end;
run;
where atpt variable is character that I want actually to put on x axis. Right?
For some reason I've got those errors:
WARNING 1-322: Assuming the symbol X was misspelled as XSP.
73: LINE and COLUMN cannot be determined.
NOTE: NOSPOOL is on. Rerunning with OPTION SPOOL might allow recovery of the LINE and COLUMN where the error has occurred.
ERROR 73-322: Expecting an =.
76: LINE and COLUMN cannot be determined.
NOTE: NOSPOOL is on. Rerunning with OPTION SPOOL might allow recovery of the LINE and COLUMN where the error has occurred.
ERROR 76-322: Syntax error, statement will be ignored.
Any idea what does this mean?
- Mark as New
- Bookmark
- Subscribe
- Mute
- RSS Feed
- Permalink
- Report Inappropriate Content
You're close. You need to rename "atpt1' to be 'x1', because that is the column that the TEXT function used to position text int he X direction:
rename atptn1 = x1;
Give that try and see if it works for you. Also, you have LABEL=STATE. In your earlier post, you mentioned special time label. Should this variable be something other than STATE (my example in the paper used STATE).
- Mark as New
- Bookmark
- Subscribe
- Mute
- RSS Feed
- Permalink
- Report Inappropriate Content
Yeah, it really helped! Much thanks!
Do you happen to know if there is a way to put a legend not right after the graph, but 2 lines lower? Without sganno?
- Mark as New
- Bookmark
- Subscribe
- Mute
- RSS Feed
- Permalink
- Report Inappropriate Content
I'm not sure what you're asking. Are you talking about POSITION=BOTTOM on the legend?
- Mark as New
- Bookmark
- Subscribe
- Mute
- RSS Feed
- Permalink
- Report Inappropriate Content
Yes. I'm asking because I've wrapped axis values in 3 lines and now they are on top of the legend. I need to move legend down. Is there easy way to do that?
- Mark as New
- Bookmark
- Subscribe
- Mute
- RSS Feed
- Permalink
- Report Inappropriate Content
Please attach sample.
You can move the legend to some other location, either inside or outside the data area. See LOCATION and POSITION options for KEYLEGEND.
- Mark as New
- Bookmark
- Subscribe
- Mute
- RSS Feed
- Permalink
- Report Inappropriate Content
Sample is attached. Location and position statements do not help. It's already position=bottom, but since I'm drawing x axis values with anno and legend is keylegend they're on top of each other.

- Mark as New
- Bookmark
- Subscribe
- Mute
- RSS Feed
- Permalink
- Report Inappropriate Content
Now seeing you example, there are too many legend entries to locate the legend on the inside. Try each one of these options and see if you get something that works for you:
keylegend / position=right across=1;
keylegend / position=top;
- Mark as New
- Bookmark
- Subscribe
- Mute
- RSS Feed
- Permalink
- Report Inappropriate Content
As Sanjay said, for SAS 9.3, your best option is to move the legend somewhere else using some combination os LOCATION and POSITION. Note that, if you use LOCATION=INSIDE without specifying a position, the rendering technology will automatically position the legend in a place of least collision with data. In SAS 9.4, maintenance 2, we also added an option on the KEYLEGEND statement called OUTERPAD, which give you the ability to move the legend down like you originally asked.
- Mark as New
- Bookmark
- Subscribe
- Mute
- RSS Feed
- Permalink
- Report Inappropriate Content
Is there way to do this in SAS 9.3?
- Mark as New
- Bookmark
- Subscribe
- Mute
- RSS Feed
- Permalink
- Report Inappropriate Content
Great idea to put legend on top or left! I'll choose one of those options I guess. Thanks a lot!
.jpg")
Catch up on SAS Innovate 2026
Nearly 200 sessions are now available on demand with the SAS Innovate Digital Pass.
Explore Now →Learn how use the CAT functions in SAS to join values from multiple variables into a single value.

Find more tutorials on the SAS Users YouTube channel.
SAS Training: Just a Click Away
Ready to level-up your skills? Choose your own adventure.
-
15 replies
-
04-10-2015 12:52 PM
-
10921 views
-
2 likes
-
5 in conversation
-
