- Home
- /
- Programming
- /
- Graphics
- /
- Add refline for each year (date sequence) on sgplot
- RSS Feed
- Mark Topic as New
- Mark Topic as Read
- Float this Topic for Current User
- Bookmark
- Subscribe
- Mute
- Printer Friendly Page
- Mark as New
- Bookmark
- Subscribe
- Mute
- RSS Feed
- Permalink
- Report Inappropriate Content
Hi - I am trying to add a refline at each year between a minimum and maximum date, with no success. Code to date is as follows:
%LET date1 = '01Jan2015';
%LET date2 = '01Jan2018';

data test;
	date= &date1.d;
	do while(date <= &date2.d);
		y = rand('NORMAL', 0, 1);
		output;
		date=intnx('month', date, 1, 's');
	end;
	format date yymmdd10.;
  run;

proc print data=test(obs=5);
run;

proc sgplot data=test;
   series x=date y=y /markers;
   refline &date1.d / axis=x lineattrs=(color=red);
   *refline (&date1.d to &date2.d by month) / axis=x lineattrs=(color=red);
run;
Any help would be greatly appreciated.
Thanks.
- Mark as New
- Bookmark
- Subscribe
- Mute
- RSS Feed
- Permalink
- Report Inappropriate Content
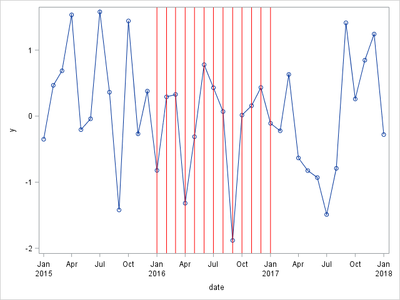
You need to use a data set variable for the REFLINE statement. In the program below, I have computed a new one called Date2 in the data step to demonstrate the usage.
proc sgplot data=test;
series x=date y=y /markers;
refline date2/ axis=x lineattrs=(color=red);
run;
%LET date1 = '01Jan2015';
%LET date2 = '01Jan2018';
data test;
date= &date1.d;
do while(date <= &date2.d);
date2=.;
y = rand('NORMAL', 0, 1);
if date >= '01jan2016'd and date <= '01Jan2017'd then date2=date;
output;
date=intnx('month', date, 1, 's');
end;
format date date2 yymmdd10.;
run;
proc print data=test;
run;
proc sgplot data=test;
series x=date y=y /markers;
refline date2/ axis=x lineattrs=(color=red);
*refline (&date1.d to &date2.d by month) / axis=x lineattrs=(color=red);
run;
- Mark as New
- Bookmark
- Subscribe
- Mute
- RSS Feed
- Permalink
- Report Inappropriate Content
Hi @Jay54. Thanks for the suggestion although I am not sure it will work in this case. Firstly, my data already exists (the data I created in the post was just to make the example reproducible) and it is not certain that a data point will exist on each year.
Learn how use the CAT functions in SAS to join values from multiple variables into a single value.
Find more tutorials on the SAS Users YouTube channel.
SAS Training: Just a Click Away
Ready to level-up your skills? Choose your own adventure.


