- Home
- /
- Programming
- /
- Graphics
- /
- Add confidence interval to a side-by-side plot
- RSS Feed
- Mark Topic as New
- Mark Topic as Read
- Float this Topic for Current User
- Bookmark
- Subscribe
- Mute
- Printer Friendly Page
- Mark as New
- Bookmark
- Subscribe
- Mute
- RSS Feed
- Permalink
- Report Inappropriate Content
Dear all.
Wish you all well.
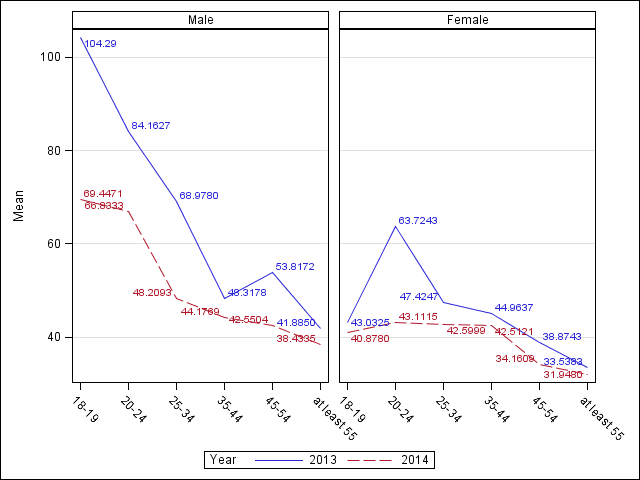
Can I please ask how do I add the 95% confidence interval to this plot?
Your help is greatly appreciated.
proc sgpanel data=LSMeans;
panelby gender / spacing=10 novarname;
vline agegrp / response=Mu group=year datalabel;
colaxis display=(nolabel);
rowaxis grid;
RUN;

- Mark as New
- Bookmark
- Subscribe
- Mute
- RSS Feed
- Permalink
- Report Inappropriate Content
Hello,
I'm assuming you mean the confidence inervals around the mean at each age group?
If so below is an example which can be applied to your data. It basically uses the series statement instead of the vline to draw the lines, and the scatter statement to plot the marker, datalabel and the confidence intervals.
data muscles;
do Rep=1 to 2;
do Time=1 to 4;
do Current=1 to 4;
do Number=1 to 3;
input MuscleWeight @@;
output;
end;
end;
end;
end;
datalines;
72 74 69 61 61 65 62 65 70 85 76 61
67 52 62 60 55 59 64 65 64 67 72 60
57 66 72 72 43 43 63 66 72 56 75 92
57 56 78 60 63 58 61 79 68 73 86 71
46 74 58 60 64 52 71 64 71 53 65 66
44 58 54 57 55 51 62 61 79 60 78 82
53 50 61 56 57 56 56 56 71 56 58 69
46 55 64 56 55 57 64 66 62 59 58 88
;
run;
ods output lsmeans = lsmeans;
proc mixed data = muscles;
class Rep Current Time Number;
model MuscleWeight = Rep Current|Time|Number;
lsmeans Current*Time / cl;
run;
quit;
proc sort data = lsmeans;
by time;
run;
proc sgpanel data = lsmeans noautolegend;
panelby current;
scatter x = time y = estimate / yerrorlower = lower yerrorupper = upper datalabel;
series x = time y = estimate;
run;
- Mark as New
- Bookmark
- Subscribe
- Mute
- RSS Feed
- Permalink
- Report Inappropriate Content
This is actually very straightforward using options on the VLINE statement. There is an option called LIMITS that turns on the limit bars. The default limit stat is CLM and the default alpha is .05, which is just what you wanted; however, I also add those options below to show you how you can control the limit calculations. There is also STDERR and STDDEV available, with an option called NUMSTD that can be used as a multiplier to get 2 std err, 3 std err, etc.
Hope this helps!
Dan
proc sgpanel data=LSMeans;
panelby gender / spacing=10 novarname;
vline agegrp / response=Mu group=year data label stat=mean limits=both limitstat=clm alpha=.05;
colaxis display=(nolabel);
rowaxis grid;
RUN;
- Mark as New
- Bookmark
- Subscribe
- Mute
- RSS Feed
- Permalink
- Report Inappropriate Content
Dear djrisks and Dan,
Thank you both for your help.
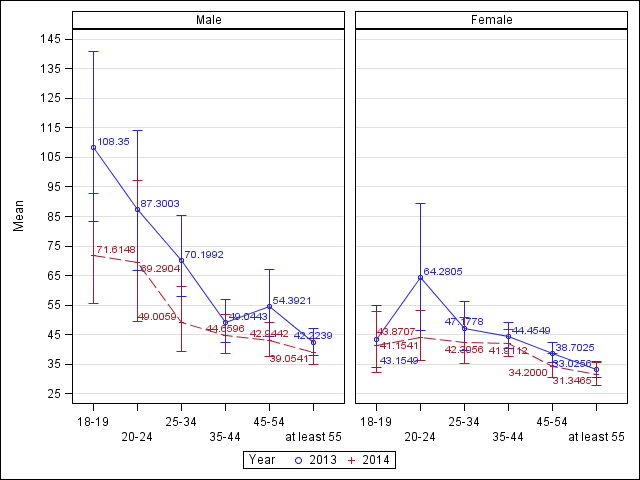
After a few attempts I am very close in getting the plot I want.
My other question now is how to create a break between zero and 25 on my vertical axis given my code below?
By the way Dan, I tried what you suggested but they don't work in my case.
Thank you very much.
proc sgpanel data=LSMeans;
panelby gender / spacing=10 novarname;
scatter x=agegrp y=Mu / group=year yerrorlower=lowermu yerrorupper=uppermu;
series x=agegrp y=Mu / group=year datalabel;
colaxis display=(nolabel) type=discrete fitpolicy=stagger;
rowaxis grid values=(25 35 45 55 65 75 85 95 105 115 125 135 145);
run;

- Mark as New
- Bookmark
- Subscribe
- Mute
- RSS Feed
- Permalink
- Report Inappropriate Content
Hi K C Wong, when you mention that you want to create a break between zero and 25 on your vertical axis, are you referring to broken axis? If so it depends on what version of SAS you have.
If you have SAS 9.4 you can break the axis more easily. Please look at Sanjay's blog - Broken Axis - Graphically Speaking.
Sanjay also discusses some techniques on how to create broken axis if you don't have SAS 9.4 here - Broken Y-Axis - Graphically Speaking
Thanks.
Learn how use the CAT functions in SAS to join values from multiple variables into a single value.
Find more tutorials on the SAS Users YouTube channel.
SAS Training: Just a Click Away
Ready to level-up your skills? Choose your own adventure.


