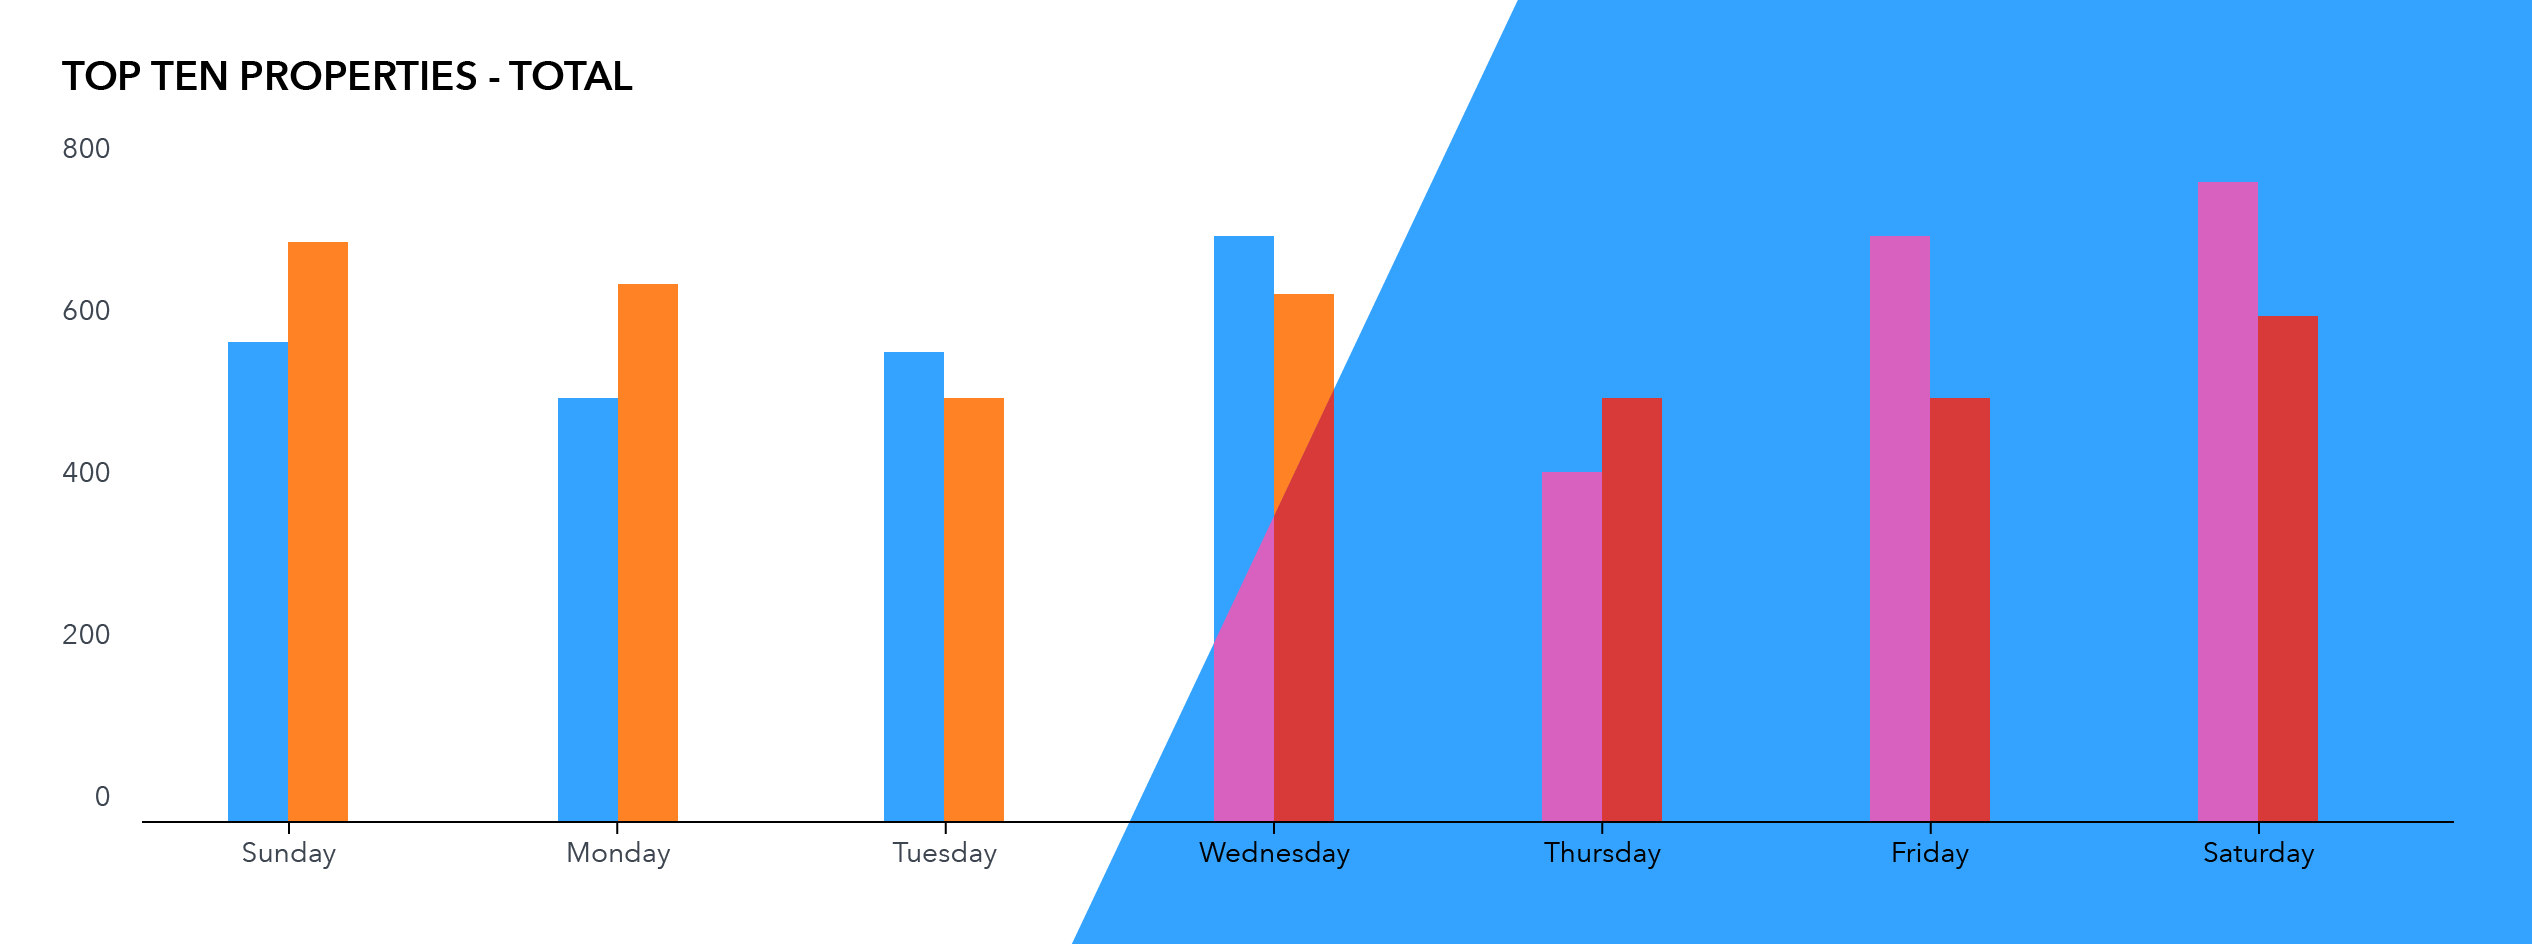
The left shows an example of a bar chart utilizing complementary colors. The right demonstrates colors which cause vibration when used together on the same bar chart.
Basic knowledge of the color wheel can help you to skillfully apply color. Colors that lie opposite of each other on the color wheel (for example, blue and orange) are known as complementary colors. When used together, side by side, or on the same page, complementary colors are considered pleasing to the eye. Using blue and orange within a graph visualization is a good idea because these colors are quickly distinguishable from each other. Keep in mind however that using these colors on top of each other (for example, red foreground and green background) causes color vibration.
Color vibration refers to the unpleasant visual appearance caused when placing certain colors on top of each other. If your report has a colored background, use black or white text as the foreground. Doing so helps to avoid color vibration, which is considered harmful to the eyes and causes a loss of detail in the foreground’s shape.
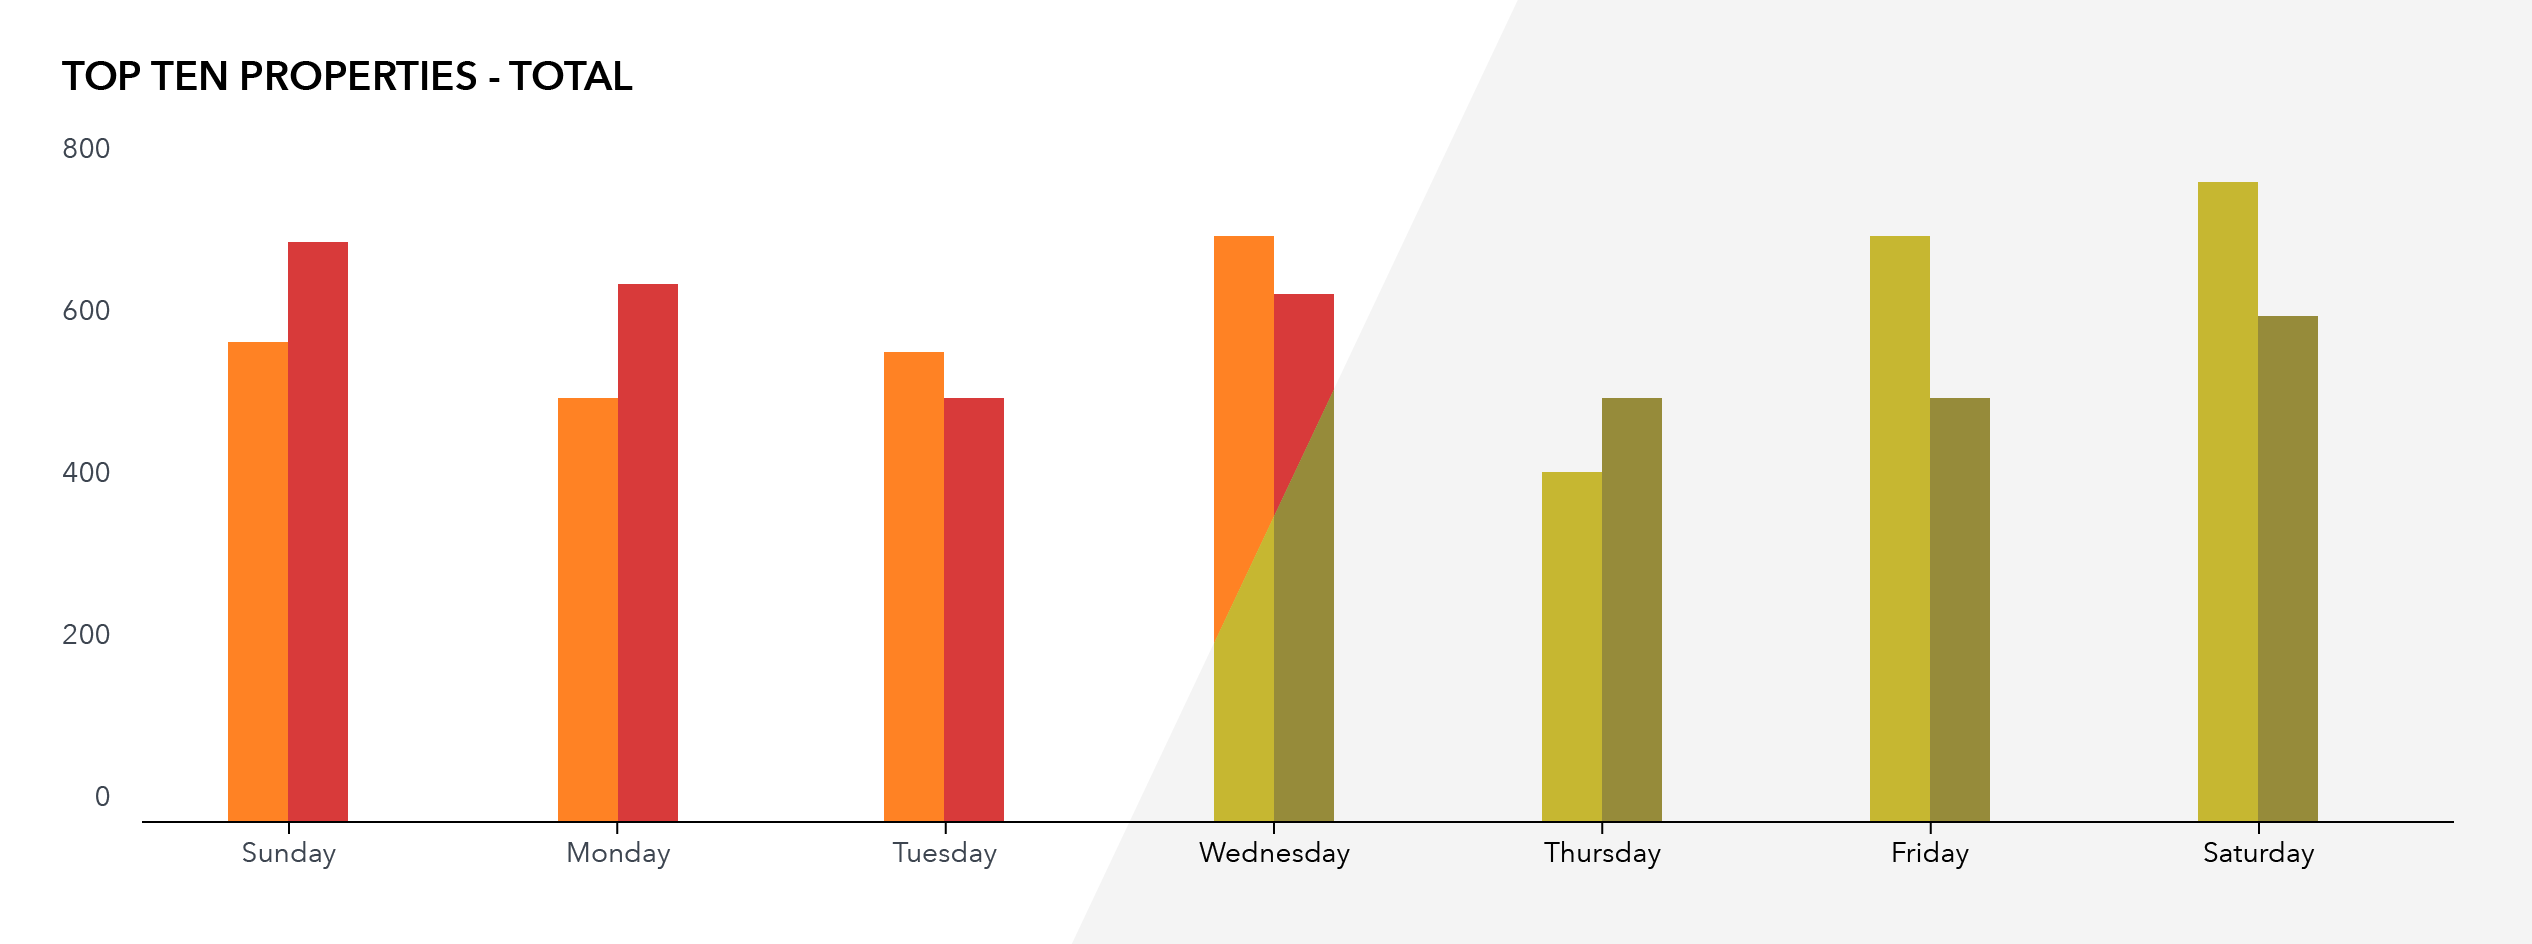
Colors adjacent to one another on the color wheel are called analogous colors. Using analogous colors within the same visualization makes it difficult to perceive the block of color, especially for those with color blindness. Eight percent of men have the most basic form of color blindness and have difficulty distinguishing colors with a red and green hue.
Also, choose background colors with sufficient contrast to your foreground elements. Depending on the context, white on a black background can have poor contrast. Black can start to “close in” on white shapes such as text.
Examples of poor contrast include:
Will your report be viewed on a computer, on a printed page, or projected onto a screen? Each location changes how color is produced.
Be mindful that individual colors and combinations of colors can have meanings that distract from your data story. For example:
If combinations of these colors are used within the same or adjacent visualizations, audiences might “fill in the gaps” inappropriately. Always display a legend to avoid confusion. For example: