- Home
- /
- Analytics
- /
- Stat Procs
- /
- Re: Ridge Regression
- RSS Feed
- Mark Topic as New
- Mark Topic as Read
- Float this Topic for Current User
- Bookmark
- Subscribe
- Mute
- Printer Friendly Page
- Mark as New
- Bookmark
- Subscribe
- Mute
- RSS Feed
- Permalink
- Report Inappropriate Content
Hello,
I tried to perform a simple ridge regression in SAS, but I am a bit confused by the results, since they do not correspond with the results in R or even with the results in proc IML, if I do the estimation by hand. The formula I used is beta = inv(T(X) * X + delta) * (T(X) * Y) , where delta is the penalty matrix with the ridge parameters on the diagonal.
I have used the following code:
/*Ridge regression*/
proc reg data=ridgedat outvif outest=ridge1_est ridge=0.4;
ods select collindiag;
ods output collindiag=ridge1_eigenvalues;
ridge1: model y = x1 x2 x3 x4 x5 x6 ;
proc print data=ridge1_est noobs;
var _type_ intercept x1 x2 x3 x4 x5 x6;
run;
/*Ridge regression by hand*/
proc iml;
USE work.ridgedat; /* Open data set for reading */
READ ALL var {x1 x2 x3 x4 x5 x6} INTO X; /* Place independent variables into X */
READ ALL var {y} INTO y; /* Place dependent variable into Y */
CLOSE work.ridgedat; /* Close data set */
X = J(nrow(X),1,1) || X; /* Add col with 1s for estimating the intercept to the X matrix */
/*Create diagonal matrix for the ridge parameter*/
ridge = J(1,ncol(X),0.4);
delta = diag(ridge);
/*Calculate paramter*/
b = inv(T(X) * X + delta) * (T(X) * y) ;
PRINT b;
run;
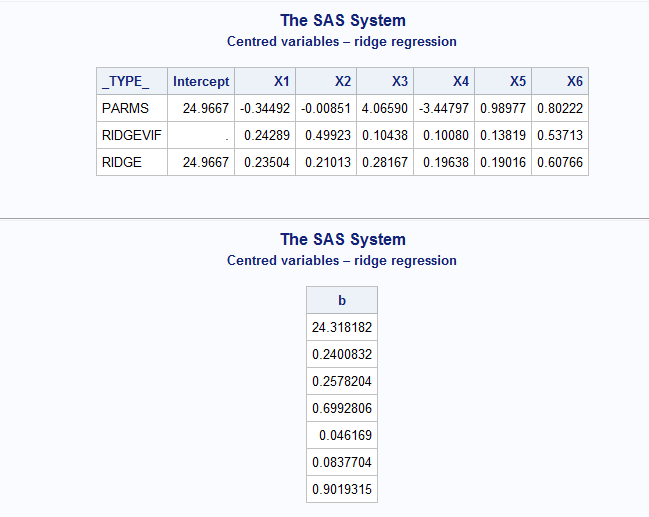
The results:

As it can be seen, the values differ significantly.
What happens? What is doing the ridge regression in proc reg? Sadly it is a black box, but maybe somone can enlighten me. ![]()
The data are attached, the x variables are standardized with mean 0 and sd 1.
Cheers,
Ben
- Mark as New
- Bookmark
- Subscribe
- Mute
- RSS Feed
- Permalink
- Report Inappropriate Content
You are using the wrong formula. The PROC REG method is documented in the section "Computations for Ridge Regression and IPC Analysis."
- Mark as New
- Bookmark
- Subscribe
- Mute
- RSS Feed
- Permalink
- Report Inappropriate Content
Thank you very much, for your quick replay.
Cheers,
Ben
- Mark as New
- Bookmark
- Subscribe
- Mute
- RSS Feed
- Permalink
- Report Inappropriate Content
For a more complete write-up and a description of how to use SAS/IML to implement the formula, see Got Matrix? Reach for the SAS/IML language - The DO Loop
ANOVA, or Analysis Of Variance, is used to compare the averages or means of two or more populations to better understand how they differ. Watch this tutorial for more.
Find more tutorials on the SAS Users YouTube channel.


