- Home
- /
- Analytics
- /
- Stat Procs
- /
- Re: Please help me to Calculate Statistics
- RSS Feed
- Mark Topic as New
- Mark Topic as Read
- Float this Topic for Current User
- Bookmark
- Subscribe
- Mute
- Printer Friendly Page

- Mark as New
- Bookmark
- Subscribe
- Mute
- RSS Feed
- Permalink
- Report Inappropriate Content
Hi All..
Your help much needed this time.I have some good understanding on Base SAS and MAcros but i am not good Enough in Statistics.so obviously i am not good enough in Statistical procedures also.
Currently I am working with one report ,in that values i need to show some statistical values such as P value,LS mean and 95 % CI.
I am looking in to Proc GLM and Proc Mixed procedures but not able to get understanding.
Here i am posting requirement and Sample data as well.Could you please provide solution for that.
That would be helpful for me..
Note :
Client mentioned that CI: Confidence Interval and p-Value should be calculate from the ANCOVA Model.
I Can able to Find Simple Stats like N Mean and SD,i struck ed with other advance stats such as P value,LS mean and 95 % CI.
Please provide Sample code for this .
Please feel free to ask any information needed for achieve above requirement.
Thanks&Regards.
Sanjeev.K
Accepted Solutions

- Mark as New
- Bookmark
- Subscribe
- Mute
- RSS Feed
- Permalink
- Report Inappropriate Content
The actual data did not come through. However, you can change the PROC GLM program sent previously to perform an analysis of covariance (see also the example in the PROC GLM documentation): * ANCOVA -- Check if intercepts for treatments are equal; * Adjust effects of treatment groups on postbase_value; * for the base_value (adjust for multiple comparisons); proc glm; class trtgrp; model postbase_value=trtgrp base_value / solution; lsmeans trtgrp / e pdiff cl stderr tdiff adjust=tukey; estimate "Drug A1 vs. B1" trtgrp 1 0 -1 0 / e; estimate "Drug A2 vs. B2" trtgrp 0 1 0 -1 / e; run; quit; * ANCOVA -- Check if slopes are equal; * Adjust the effects of treatment groups on postbase_value; * for base_value and interactions between treatment * groups and base_value (adjust for multiple comparisons); proc glm; class trtgrp; model postbase_value = trtgrp base_value trtgrp*base_value / solution; lsmeans trtgrp / e pdiff cl stderr tdiff adjust=tukey; run; quit; If any of the interactions, trtgrp*base_value, differ statistically significantly from zero, then you should not compare the effects of trtgrp on the postbase_value because these effects will vary depending on the levels of the base_value. You can estimate these effects at specific levels of the base_value (see the AT option of the LSMEANS statement). Although this program presents the test for intercept values first and the test for slopes (interaction terms) second, you should test for interaction terms first.

- Mark as New
- Bookmark
- Subscribe
- Mute
- RSS Feed
- Permalink
- Report Inappropriate Content
Hire a statistician.

- Mark as New
- Bookmark
- Subscribe
- Mute
- RSS Feed
- Permalink
- Report Inappropriate Content
Hi, you have posted a somehow similar question here:
https://communities.sas.com/message/172117#172117
As mentioned, it may be time to look ito hiring a statistician ![]()
- Mark as New
- Bookmark
- Subscribe
- Mute
- RSS Feed
- Permalink
- Report Inappropriate Content
Yup..I posted same question but there i did't get proper solution because i don't have sample data.
and you provided solutions like
proc glm data = sashelp.class;
class sex; *need to put your group variable in the class statement
model age = sex;
lsmeans sex/stderr cl;
run;quit;
Still is this sufficient to my above requirement.???
Regards.
Sanjeev.K
- Mark as New
- Bookmark
- Subscribe
- Mute
- RSS Feed
- Permalink
- Report Inappropriate Content
There's a lot that goes into the choosing the correct model besides just saying ANCOVA. Its so easy to make a mistake in the modeling, I don't know how many questions are on here from logistic regression where people don't realize that SAS default settings aren't what they want or what gets taught in class. In good faith, I don't want to be responsible for suggesting something that could lead to incorrect results and decisions unless I was fully involved, especially if its health care, because that's playing with peoples lives.
I really strongly suggest getting a statistician on board to help test this. IMO not hiring one is also a bit shortsighted, because a statistician can suggest further models/tests that will help a client in their reports/analysis which is part of building a good client relationship.
*steps off soapbox*
- Mark as New
- Bookmark
- Subscribe
- Mute
- RSS Feed
- Permalink
- Report Inappropriate Content

- Mark as New
- Bookmark
- Subscribe
- Mute
- RSS Feed
- Permalink
- Report Inappropriate Content
It means "End of speech" . See Soapbox - Wikipedia, the free encyclopedia. - PG
- Mark as New
- Bookmark
- Subscribe
- Mute
- RSS Feed
- Permalink
- Report Inappropriate Content
Understood.:smileyblush:
- Mark as New
- Bookmark
- Subscribe
- Mute
- RSS Feed
- Permalink
- Report Inappropriate Content
The data your provided in the Excel spreadsheet contain three variables--PT, Treatment, and Value. Only one treatment and one value are provided for each PT (? patient ID). There are four different kinds of Treatment. Since you do NOT have baseline or 21-day follow-up values for each individual, and since no other variables are available to act as numerical covariates, the use of analysis of covariance (ANCOVA) and of least-square means (adjusted for such covariates) is NOT appropriate. All you can do with these data is an analysis of variance (ANOVA) to determine the effects of different treatments on your dependent variable, Value, and contrasts in these values between these treatments. If you have other variables that can act as numerical covariates, or if you have two or more values of your dependent variable for each PT, you may be able to use ANCOVA (see the example in the PROC GLM documentation).
- Mark as New
- Bookmark
- Subscribe
- Mute
- RSS Feed
- Permalink
- Report Inappropriate Content
Thanks for your Reply..
Let me clarify the thing were asked in earlier post.
There are four treatment arms planned for the study- Group A, Group B, Group C, Group D.and different study drug will be applied for each group like bellow.
| Groups | Study drug |
|---|---|
| Group A | A1 |
| Group B | A2 |
| Group C | B1 |
| Group D | B2 |
Coming to the Value column.
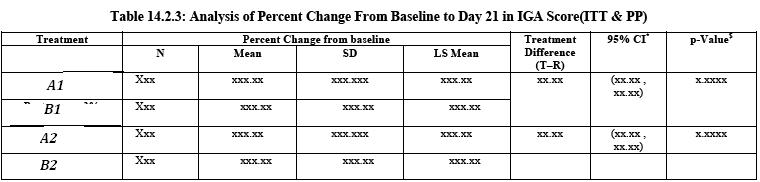
I am working on "Analysis of Percent Change from Baseline to Day 21 in EASI Score by treatment" table.
So i calculated percent change from Baseline to Day21 in EASI value and provided that values in "Value" column.
Please let me know any thing needed..
Thanks &Regards.
Sanjeev.K
- Mark as New
- Bookmark
- Subscribe
- Mute
- RSS Feed
- Permalink
- Report Inappropriate Content
If Value is the percent change from baseline that you have already calculated, you can analyze it directly with PROC GLM as an analysis of variance (ANOVA) that compares values for each of the study drugs. proc glm; class treatment; model value=treatment / solution; means treatment / deponly tukey; estimate "drug A1 vs. B1" treatment 1 0 -1 1 / e; estimate "drug A2 vs. B2" treatment 0 1 0 -1 / e; lsmeans treatment / e pdiff stderr tdiff; run; quit; The LSMEANS statement will provide the same estimates of the mean values for each treatment as the MEANS statement because you have only treatment as an independent variable and no other covariates. Since you already have calculated Value as the percent change from baseline, analysis of covariance (ANCOVA) is no longer appropriate. ANCOVA would require including the baseline estimate of value as an independent variable with treatment and the day 21 value as the dependent variable. The regression coefficient minus 1 for each treatment would indicate the change in the day 21 value as a proportion, which could be converted into a percent change.

- Mark as New
- Bookmark
- Subscribe
- Mute
- RSS Feed
- Permalink
- Report Inappropriate Content
Be very careful about analyzing percent change from baseline--it is the equivalent of an analysis of covariance with the regression coefficient for the covariate (baseline) set to -1. This does not optimize the analysis, and in fact, can lead to a complete misinterpretation of any drug effects. See Statistical Issues in Drug Development, Stephen Senn, 2011 FDA/Industry Statistics Workshop.
Matt's last analysis addresses this all in a good way. It's just hard to read, because the forum's word processor doesn't like the formatting.
Steve Denham
- Mark as New
- Bookmark
- Subscribe
- Mute
- RSS Feed
- Permalink
- Report Inappropriate Content
And here i am attaching actual data for your reference ,in that i haven't calculated percent change.
This data contains 2 numeric variables "Base_value" and Postbase_value" with respective treatment group (TRTGRP).
Once again thanks a lot for your support.
Thanks &Regards.
Sanjeev.K
- Mark as New
- Bookmark
- Subscribe
- Mute
- RSS Feed
- Permalink
- Report Inappropriate Content
The actual data did not come through. However, you can change the PROC GLM program sent previously to perform an analysis of covariance (see also the example in the PROC GLM documentation): * ANCOVA -- Check if intercepts for treatments are equal; * Adjust effects of treatment groups on postbase_value; * for the base_value (adjust for multiple comparisons); proc glm; class trtgrp; model postbase_value=trtgrp base_value / solution; lsmeans trtgrp / e pdiff cl stderr tdiff adjust=tukey; estimate "Drug A1 vs. B1" trtgrp 1 0 -1 0 / e; estimate "Drug A2 vs. B2" trtgrp 0 1 0 -1 / e; run; quit; * ANCOVA -- Check if slopes are equal; * Adjust the effects of treatment groups on postbase_value; * for base_value and interactions between treatment * groups and base_value (adjust for multiple comparisons); proc glm; class trtgrp; model postbase_value = trtgrp base_value trtgrp*base_value / solution; lsmeans trtgrp / e pdiff cl stderr tdiff adjust=tukey; run; quit; If any of the interactions, trtgrp*base_value, differ statistically significantly from zero, then you should not compare the effects of trtgrp on the postbase_value because these effects will vary depending on the levels of the base_value. You can estimate these effects at specific levels of the base_value (see the AT option of the LSMEANS statement). Although this program presents the test for intercept values first and the test for slopes (interaction terms) second, you should test for interaction terms first.
- Mark as New
- Bookmark
- Subscribe
- Mute
- RSS Feed
- Permalink
- Report Inappropriate Content
Thanks a lot !!!!!!!!!!!!!!!
Thanks &Regards.
Sanjeev.K
SAS Innovate 2025: Save the Date
SAS Innovate 2025 is scheduled for May 6-9 in Orlando, FL. Sign up to be first to learn about the agenda and registration!
ANOVA, or Analysis Of Variance, is used to compare the averages or means of two or more populations to better understand how they differ. Watch this tutorial for more.

Find more tutorials on the SAS Users YouTube channel.
-
14 replies
-
07-25-2013 10:46 AM
-
5232 views
-
1 like
-
6 in conversation
-
