- Home
- /
- SAS Viya
- /
- Visual Analytics
- /
- Re: problem with display rule on a measure in va7.1
- RSS Feed
- Mark Topic as New
- Mark Topic as Read
- Float this Topic for Current User
- Bookmark
- Subscribe
- Mute
- Printer Friendly Page

- Mark as New
- Bookmark
- Subscribe
- Mute
- RSS Feed
- Permalink
- Report Inappropriate Content
Hello,
I have a question about the display rules in sas va7.1.
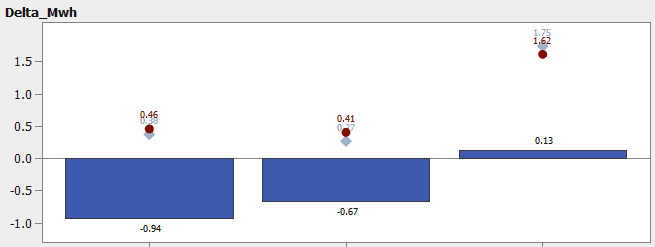
I've created a graph with 1 bar and 2 lines. The bar has a measure 'Delta_MWh', the 2 lines have measures Y and Z.
These measures are in the graph shown per team.
I want to turn the color of the bar into red when the value of 'Delta_MWh' is negative (<0) and in green when positive (>0).
So I made a display rule saying: 'Delta_MWh'<0, color red and 'Delta_MWh'>0, color green.
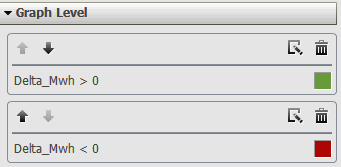
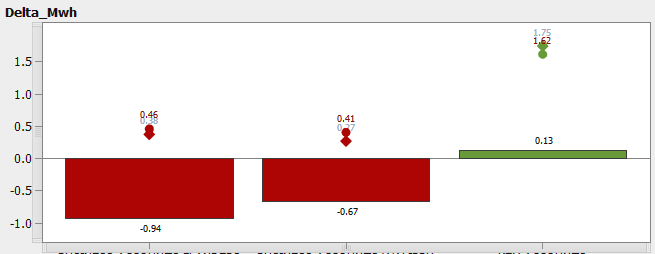
The result is that when 'Delta_MWh' is negative the whole team colors in red. So also the 2 lines (only the points are shown) are colored red while I only want to show the bar ('Delta_MWh') in red. Because the points have a fixed color. Is there a solution for this?
Graph without display rule:
Graph with display rule:

- Mark as New
- Bookmark
- Subscribe
- Mute
- RSS Feed
- Permalink
- Report Inappropriate Content
Hi,
You went something thing wrong while building custom graph!!, first tella me how many measures you have, in the above example you are showing only one measure?
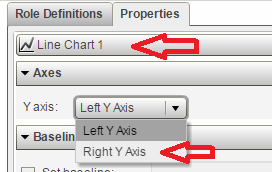
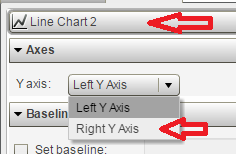
Select Line chart1 & Line Chart2 Axis to Right Axis in custom graph builder (by default it will shows Left Axis).
Here is the screen shot:
Hope that this will help you...
Thanks & Regards,
Teja Surapaneni
- Mark as New
- Bookmark
- Subscribe
- Mute
- RSS Feed
- Permalink
- Report Inappropriate Content
Hi,
Thanks for your answer.
Just tried this but I still have the same problem.
Both line markers colors into the same as the bar.
Best Regards,
Sven
- Mark as New
- Bookmark
- Subscribe
- Mute
- RSS Feed
- Permalink
- Report Inappropriate Content
Hi Sven,
Can you share your custom graph steps & What what are the measures you have taken.
Thanks & Regards
Teja Surapaneni
- Mark as New
- Bookmark
- Subscribe
- Mute
- RSS Feed
- Permalink
- Report Inappropriate Content
Hi Teja,
I made a custom graph with one bar and 2 line charts.
After this, I kept the Y axis for the bar chart as a 'Left Y axis' and for the 2 line charts I changed the Y axis into a 'Right Y axis'. For the 2 lines I unchecked 'show line' and checked 'show markers'. For the rest nothing special for the Custom graph.
I use 3 different measures. (Measure X, Y and Z)
I created a display rule on measure X. (Where X is negative: color red, when X is positive: color green).
I didn't create a display rule for measures Y and Z. The measures Y and Z will always be positive and should keep always the color of the legend (orange and blue).
Hope this are enough details. (I can't give much more detail)
Regards,
Sven
- Mark as New
- Bookmark
- Subscribe
- Mute
- RSS Feed
- Permalink
- Report Inappropriate Content
Hi,
You are selecting only 'show Markers'.
Select 'Show line' also.
Thanks & Regards,
Teja Surapaneni.
- Mark as New
- Bookmark
- Subscribe
- Mute
- RSS Feed
- Permalink
- Report Inappropriate Content
Hi Teja,
The lines aren't colored by the displaty rule, but the markers still have the same problem.
If I only select 'show line' the display rule works.
Is this a bug in SAS VA7.1?
I think normally the display rule should work correctly when you only select 'show markers'.
Regards,
Sven
.jpg")
Catch up on SAS Innovate 2026
Nearly 200 sessions are now available on demand with the SAS Innovate Digital Pass.
Explore Now →See how to use one filter for multiple data sources by mapping your data from SAS’ Alexandria McCall.

Find more tutorials on the SAS Users YouTube channel.
-
6 replies
-
05-13-2015 08:53 AM
-
4107 views
-
0 likes
-
2 in conversation
-
