- Home
- /
- SAS Viya
- /
- Visual Analytics
- /
- interaction between drop downlists and chart mixing up?
- RSS Feed
- Mark Topic as New
- Mark Topic as Read
- Float this Topic for Current User
- Bookmark
- Subscribe
- Mute
- Printer Friendly Page

- Mark as New
- Bookmark
- Subscribe
- Mute
- RSS Feed
- Permalink
- Report Inappropriate Content
Hi,
I am working on a dashboard (report) that has 2 dropdown filters on the canvas, in order to define an interaction between them. One contains the Year category, the other one organisational structure . Reason is that in 2013 the organisational structure differs form that in 2014. I got this working.
Now I want to define interactions between the 2 drop downs with charts in the reports. I manage to add the interactions, but somehow the mapping settings of both drop downs seem to interact. The end result is that both interactions have the same mapping for either year or sector, resulting in one disfunctional dropdown filter. Both dropdown filters are based on the same data source.
Has anyone experienced this also? Is my construction not feasible? Is there another way?
Many thanks..
PS: using sas va 6.4m
Accepted Solutions

- Mark as New
- Bookmark
- Subscribe
- Mute
- RSS Feed
- Permalink
- Report Inappropriate Content
Hi,
Thanks for the screenshot. I am wondering if it may be the order in which you have set up the interactions. In the explanation above you said that you had initially set up both drop downs with separate interactions to 10 eerste onderzoeken and because of that when you filter from dropdown 9 it isn't subsetting dropdown 10. Perhaps you could delete the 3 interactions and set up the following:
1) filter interaction from dropdown 9 to dropdown 10
2) filter interaction from dropdown 10 to 10 eerste onderzoeken - when you do this a derived interaction (dotted line) should appear from dropdown9 to 10 eerste onderzoeken, if the derived interaction checkbox is marked. The derived interaction is due to the filter flow from dropdown 9 also affecting the chart. As such a direct filter interaction would not be needed from dropdown 9 to 10 eerste onderzoeken.
Hope this helps.
Cheers,
Michelle
- Mark as New
- Bookmark
- Subscribe
- Mute
- RSS Feed
- Permalink
- Report Inappropriate Content
Hi,
Would it be possible for you to take a screenshot of your Interaction View screen so that we can get a better understanding of the issue? From the right pane, select the Interactions tab and click on the Interaction View button or use the View -> Show Interactions menu item.
Can you please confirm your statement "The end result is that both interactions have the same mapping for either year or sector"... you mean when you select year or organisational structure the filter is not happening or that it is and if so, what is the filter being passed to the chart (click on the chart object and the funnel icon on the tab - this will tell you what is being filtered).
I haven't experienced this before and your construction sounds feasible - hard to say without seeing it though. Assuming, the data is loaded appropriately in the table for filtering, it could simply be that your interactions need to be set up correctly.
Kind Regards,
Michelle
- Mark as New
- Bookmark
- Subscribe
- Mute
- RSS Feed
- Permalink
- Report Inappropriate Content
Hi Michelle,
see below:
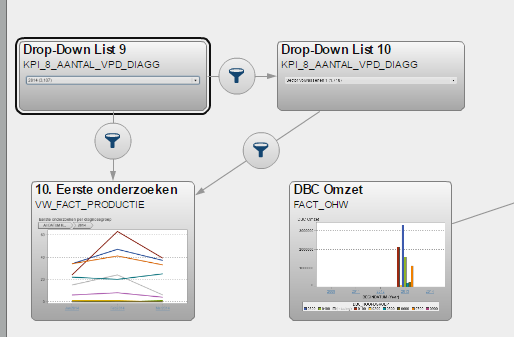
What I meant by The end result is that both interactions have the same mapping for either year or sector".
Is that I initially set up both drop downs with separate interactions to 10 eerste onderzoeken, dropdown 9 with a mapping for year category, dropdown10 with sector category mapping (which are the visible values in respective drop downs).
After some testing I notice the interaction works for the year category . But when I also click on dropdown10 to filter sectors, the whole thing gets confused: I notice that drop down 9 is not filtering 10 eerste onderzoeken anymore. When opening the mapping of the interaction I see it's now same as the mapping from drop down10, namely sector category.
Hope this clarifies some!
THanks!
- Mark as New
- Bookmark
- Subscribe
- Mute
- RSS Feed
- Permalink
- Report Inappropriate Content
Hi,
Thanks for the screenshot. I am wondering if it may be the order in which you have set up the interactions. In the explanation above you said that you had initially set up both drop downs with separate interactions to 10 eerste onderzoeken and because of that when you filter from dropdown 9 it isn't subsetting dropdown 10. Perhaps you could delete the 3 interactions and set up the following:
1) filter interaction from dropdown 9 to dropdown 10
2) filter interaction from dropdown 10 to 10 eerste onderzoeken - when you do this a derived interaction (dotted line) should appear from dropdown9 to 10 eerste onderzoeken, if the derived interaction checkbox is marked. The derived interaction is due to the filter flow from dropdown 9 also affecting the chart. As such a direct filter interaction would not be needed from dropdown 9 to 10 eerste onderzoeken.
Hope this helps.
Cheers,
Michelle
- Mark as New
- Bookmark
- Subscribe
- Mute
- RSS Feed
- Permalink
- Report Inappropriate Content
Hi,
I had come to the same conclusion myself already: choose the right year in dropdown(dd) 9. This filters dd10. FIlter the chart with the sector of choice from dd10. This also filters the data for the the year of choice in dd9 indirectly.
Thanks again! Cheers
- Mark as New
- Bookmark
- Subscribe
- Mute
- RSS Feed
- Permalink
- Report Inappropriate Content
Hi,
It seems that the issue is now resolved? If so, please mark the question as answered so that the community knows.
Thanks,
Michelle
.jpg")
Catch up on SAS Innovate 2026
Nearly 200 sessions are now available on demand with the SAS Innovate Digital Pass.
Explore Now →See how to use one filter for multiple data sources by mapping your data from SAS’ Alexandria McCall.

Find more tutorials on the SAS Users YouTube channel.
-
5 replies
-
10-27-2014 05:00 AM
-
3425 views
-
0 likes
-
2 in conversation
-
