- Home
- /
- SAS Viya
- /
- Visual Analytics
- /
- What's new in SAS Visual Analytics 7.3: HTML5-based web viewer
- RSS Feed
- Mark Topic as New
- Mark Topic as Read
- Float this Topic for Current User
- Bookmark
- Subscribe
- Mute
- Printer Friendly Page
- Mark as New
- Bookmark
- Subscribe
- Mute
- RSS Feed
- Permalink
- Report Inappropriate Content
There are lots of new features in SAS Visual Analytics 7.3, and the community will post a series of articles calling them out. To begin, let’s take a look at what looks different in the new HTML5-based web viewer - a feature that you've already shown interest in.
SAS Visual Analytics 7.3 will present the HTML5 based web viewer as the default.
Some new features and differences you can see in the HTML5 viewer compared to the flash viewer are as follows:
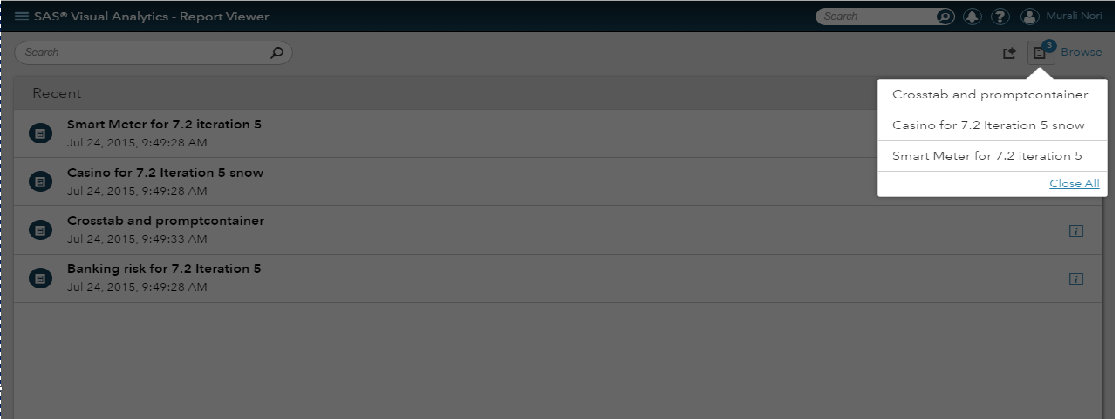
Recent page – You can see and open recently used reports. This page also has a Search box to find the report from a list of recently opened reports. Example:

Opened items – (open multiple reports but view one at a time) – You now have access to multiple reports at one time. These reports are cached so you can open the report immediately with no delay. Example:

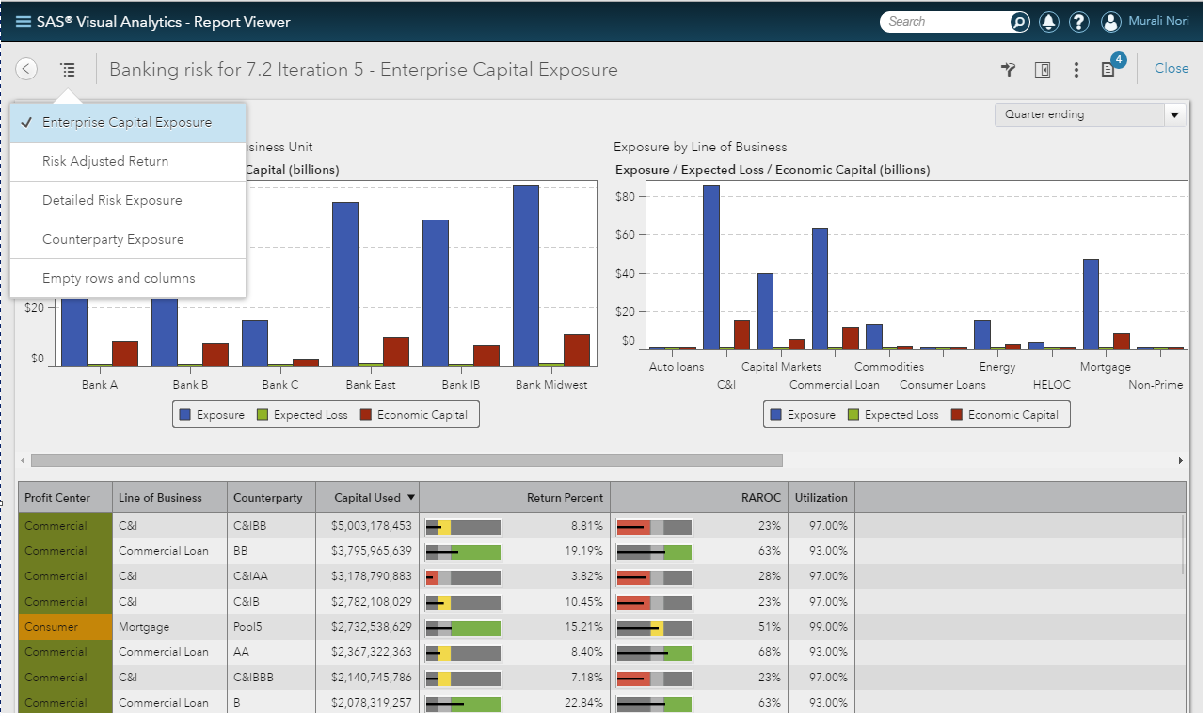
Section Navigation – Navigate each section by using a drop down button/icon found on the top left. Example:

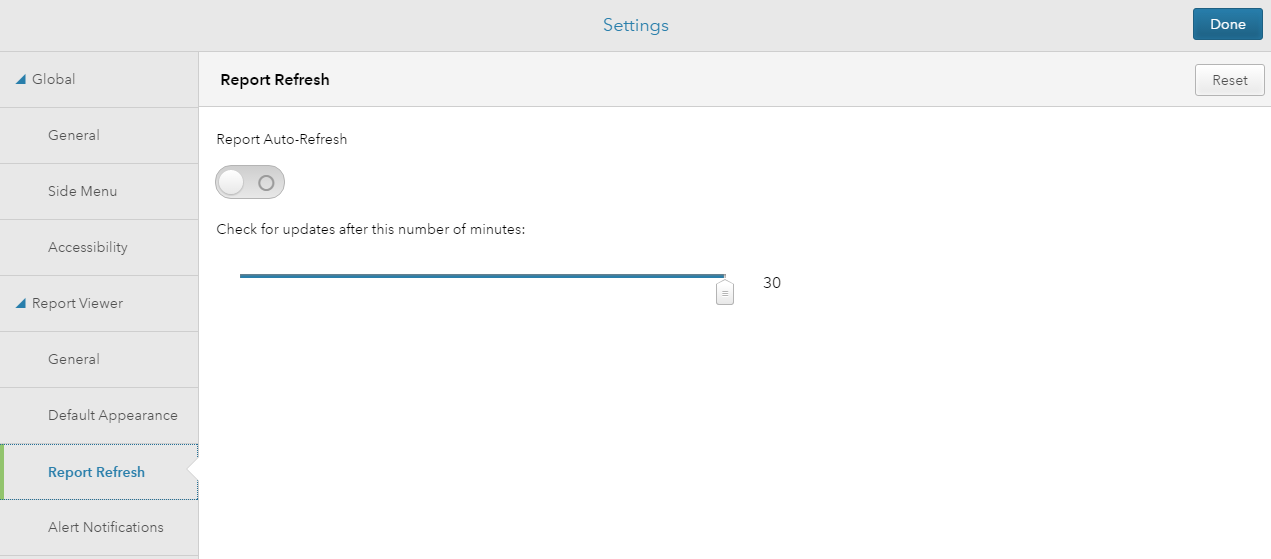
Auto Report refresh – You now have the ability to set the report to auto refresh. Example:

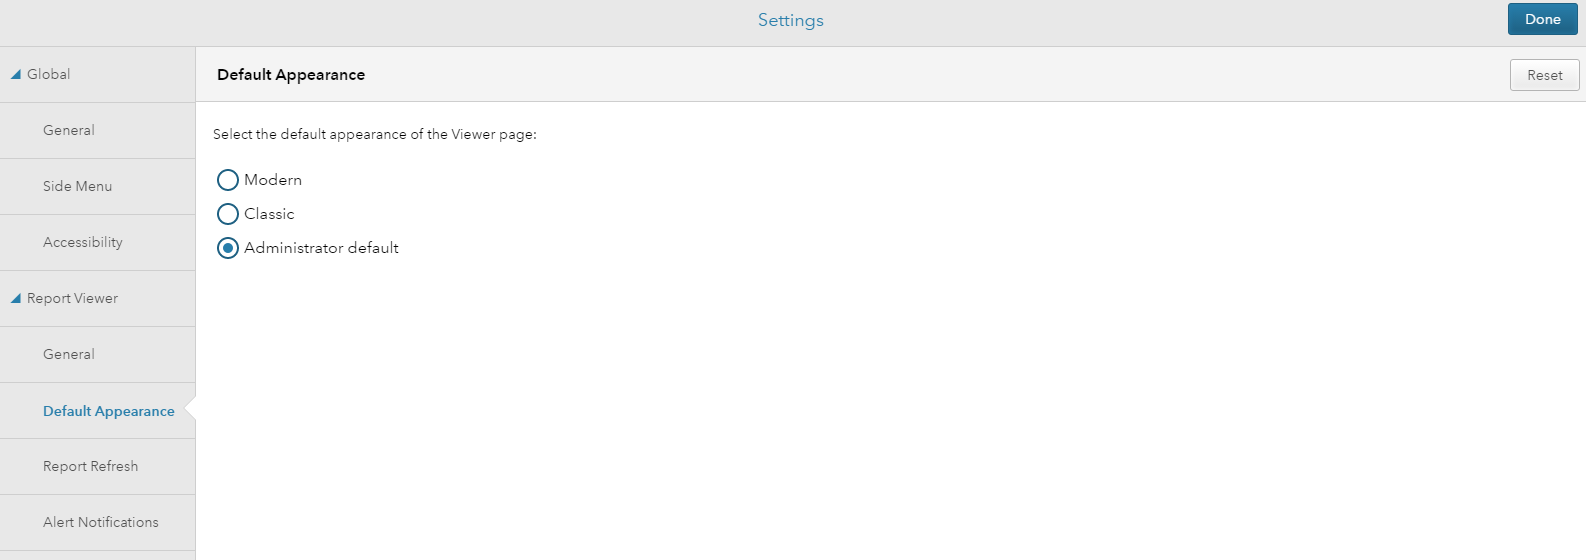
Appearance setting. This screen lets you choose the best appearance for your project. “Classic” signifies Flash-based viewer; “Modern” represents HTML-based web viewer.
Here’s an example of the print dialog in the HTML5 web viewer:

Browser support – The SAS Visual Analytics 7.3 hub and viewer are supported on the following browsers:
- Chrome
- Firefox
- Safari
- IE – 11 (only)
For browsers that are not compatible for HTML5, like IE9, IE10, the viewer will default to the Flash based web viewer.
ON mobile devices, users will be redirected to “SAS Mobile BI” native application.
Related links:
SAS(R) Visual Analytics 7.3: User's Guide
Visual Analytics 7.3: A peek at HTML5 interfaces
- Mark as New
- Bookmark
- Subscribe
- Mute
- RSS Feed
- Permalink
- Report Inappropriate Content
Thanks for this information. I'm interested in the browser support you mention. We currently run VA 7.2, which has the new hub as default, and this runs in IE 10. Would this, as I think you are saying, change in 7.3? Thanks!
- Mark as New
- Bookmark
- Subscribe
- Mute
- RSS Feed
- Permalink
- Report Inappropriate Content
- Mark as New
- Bookmark
- Subscribe
- Mute
- RSS Feed
- Permalink
- Report Inappropriate Content
This is an old posting.
You might be interested in a preview of the upcoming 8.2 release.
-------------------------------------------------------------------------
Four tips to remember when you contact SAS Technical Support
Tricks for SAS Visual Analytics Report Builders
SAS Visual Analytics Learning Center
- Mark as New
- Bookmark
- Subscribe
- Mute
- RSS Feed
- Permalink
- Report Inappropriate Content
See how to use one filter for multiple data sources by mapping your data from SAS’ Alexandria McCall.
Find more tutorials on the SAS Users YouTube channel.


