- Home
- /
- SAS Viya
- /
- Visual Analytics
- /
- Re: VA Performance results/experience with a concurrent workload
- RSS Feed
- Mark Topic as New
- Mark Topic as Read
- Float this Topic for Current User
- Bookmark
- Subscribe
- Mute
- Printer Friendly Page

- Mark as New
- Bookmark
- Subscribe
- Mute
- RSS Feed
- Permalink
- Report Inappropriate Content
Hey,
i did not find a paper or documentation about VA Performance results or some user experience.
Maybe anybody can help me with the following questions.
I am searching for an valid statement, how much concurrent workload Visual Analytics running on an Single Machine (SMP) can handle.
Of course this depends on the table size, hardware sizing and many other parameters.
But maybe there is a calculation example?
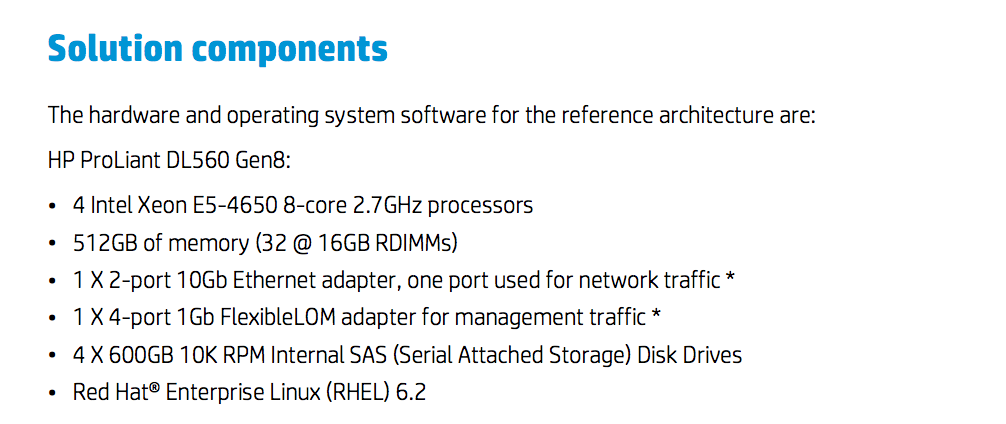
I only found this paper with some Performance results.
http://h20195.www2.hp.com/V2/GetPDF.aspx%2F4AA5-1601ENW.pdf
[.....]SMP solutions, and allows for larger number of users to access those data sets concurrently. [...]
What is a larger number of users? They tested the performance with 5 light users and 1 heavy user and a 32GB dataset.
If i look at the CPU Utilization there isn`t much tolerance.
They used the following components :
I think we will use :
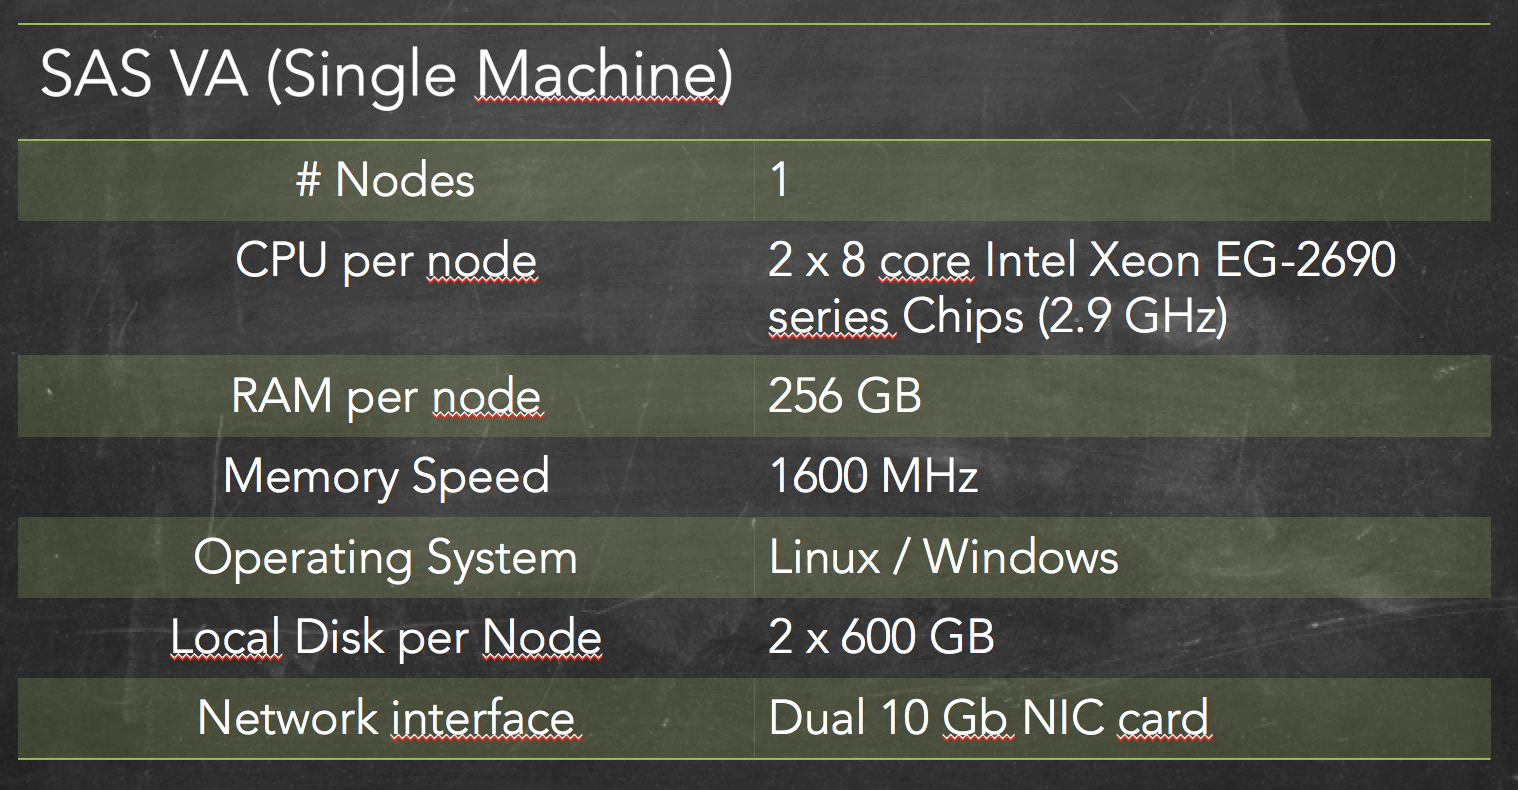
So they have more ports to manage the network traffic. This will be probably the biggest faktor?
We won`t have 32 GB but much more concurrent Users.
I think :
max 6 GB
max 20 concurrent
Greetings from Germany
Marius
Accepted Solutions

- Mark as New
- Bookmark
- Subscribe
- Mute
- RSS Feed
- Permalink
- Report Inappropriate Content
I think I was able to find exactly what you are looking for. I posted the document to the forum as an article:
Hope that helps!
- Mark as New
- Bookmark
- Subscribe
- Mute
- RSS Feed
- Permalink
- Report Inappropriate Content
, unfortunately, I can't give you a formula to calculate what kind of load a given number of users will place on the system. There are just too many variables-- not only does number of users, data size and schema, and hardware play a role, but the activities of the users is a huge factor. I can create a report with simple tables and graphs that perform little more than summarizations or I could create a report that is exported from VA Explorer with heat maps and decision trees that creates significant more load on the system. If I then have 20 users just viewing each of those reports, one group puts much bigger load on the system than the other, even though both groups are just "viewing reports".
And although I hope that helps to understand why it's near impossible to provide a formula, it doesn't answer your question.
6 GB isn't much data and 20 users is more than reasonable for that system-- You will be fine. I will pull up some of our performance testing numbers and post them later today.
Hoffentlich, hilft das etwa!
- Mark as New
- Bookmark
- Subscribe
- Mute
- RSS Feed
- Permalink
- Report Inappropriate Content
- Mark as New
- Bookmark
- Subscribe
- Mute
- RSS Feed
- Permalink
- Report Inappropriate Content
Hello David,
the paper is exactly what i need.
I thank you ![]()
see you soon,
Marius
.jpg")
Catch up on SAS Innovate 2026
Nearly 200 sessions are now available on demand with the SAS Innovate Digital Pass.
Explore Now →See how to use one filter for multiple data sources by mapping your data from SAS’ Alexandria McCall.

Find more tutorials on the SAS Users YouTube channel.
-
3 replies
-
05-07-2014 03:17 AM
-
3589 views
-
0 likes
-
2 in conversation
-
