- Home
- /
- SAS Viya
- /
- Visual Analytics
- /
- Using New Calculated Data Items in Exploration SAS VA
- RSS Feed
- Mark Topic as New
- Mark Topic as Read
- Float this Topic for Current User
- Bookmark
- Subscribe
- Mute
- Printer Friendly Page
- Mark as New
- Bookmark
- Subscribe
- Mute
- RSS Feed
- Permalink
- Report Inappropriate Content
Hi,
I am not able to use new calculated data items in Exploration phase of SAS VA. Say for ex. I have product lines for which I created a distinct count. Now I wanted to consume this new data item in my analysis. But while I try to plot, only the existing measures are allowed to use. Options do exists to create new items but it becomes of no use when you cannot consume it in your objects for analysis.
Is there any possibilities or am I missing out something here?
greetings
satlr
- Mark as New
- Bookmark
- Subscribe
- Mute
- RSS Feed
- Permalink
- Report Inappropriate Content
Hi there,
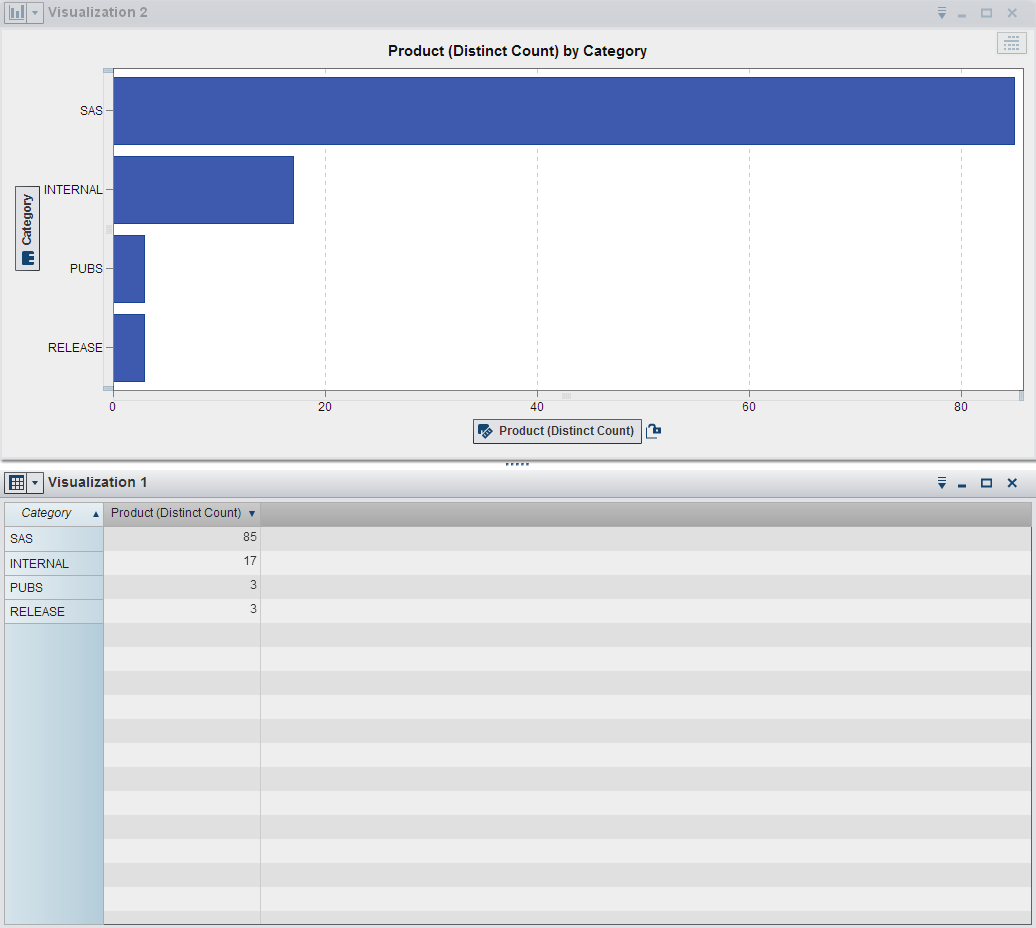
Which version of VA you're using? This might not have been possible in earlier versions but below is an example created with 6.4.
- Mark as New
- Bookmark
- Subscribe
- Mute
- RSS Feed
- Permalink
- Report Inappropriate Content
hi nascif..I am using 6.3. option do exists to create new aggregated measure but couldn't able to use it.
satlr
- Mark as New
- Bookmark
- Subscribe
- Mute
- RSS Feed
- Permalink
- Report Inappropriate Content
For this particular aggregated measure you also need a category in your visualization. That is what will indicate what the measure is being aggregated over.
So you can use it in a bar chart, for example, but not in a scatter plot.
In a crosstab, you need to specify the category as well - just the measure is not sufficient. It will give you a single value for the whole dataset, probably not what you want?
What visualization you are trying to create with it? Can you try to reproduce the ones I created above?
See how to use one filter for multiple data sources by mapping your data from SAS’ Alexandria McCall.
Find more tutorials on the SAS Users YouTube channel.


