- Home
- /
- SAS Viya
- /
- Visual Analytics
- /
- Using Graph Builder with Variable Column name
- RSS Feed
- Mark Topic as New
- Mark Topic as Read
- Float this Topic for Current User
- Bookmark
- Subscribe
- Mute
- Printer Friendly Page

- Mark as New
- Bookmark
- Subscribe
- Mute
- RSS Feed
- Permalink
- Report Inappropriate Content
Hi,
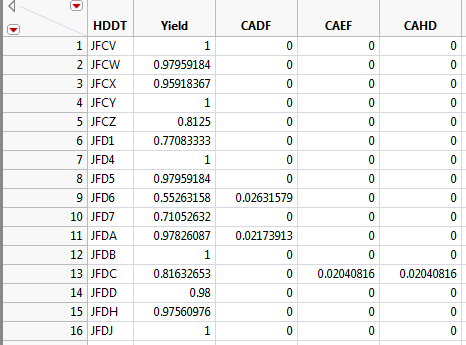
Sample Data Table:
My script is like this,
tt = Graph Builder(
Show Control Panel( 0 ),
Variables(
X( :HDDT ),
Y( :Yield, Side( "Right" ) ),
Y( :CAEF, Position( 1 ) ),
Y( :CAHD, Position( 1 ) )
),
Elements(
Bar(
X,
Y( 2 ),
Y( 3 ),
Y( 4 ),
Legend( 1 ),
Jitter( 1 )
),
Points( X, Y( 1 ), Legend( 2 ), Jitter( 1 ) )
)
)
But then, only Column "HDDT" and "Yield" is the fixed name for every data I will gather. Columns with "CA**" will change every batch of data.
So I want to create a script that these columns of "CA**" will be variable.
Currently, I create a script like this,
For (i=3,i<=ncols,i++,
tt = Graph Builder(
Show Control Panel( 0 ),
Variables(
X( :HDDT ),
Y( :Yield, Side( "Right" ) ),
Y( :Column(i),Position( 1 ))
),
Elements(
Points(
X,
Y( i ),
Legend( 1 ),
Jitter( 1 )
),
Points( X, Y( 1 ), Legend( 2 ), Jitter( 1 ) )
)
)
But the result, instead of 1 graph will appear, each "Y variable" is coming out.
Is there a best way? Thank you for the help. ^_^

- Mark as New
- Bookmark
- Subscribe
- Mute
- RSS Feed
- Permalink
- Report Inappropriate Content
Hi there! I moved your question to the SAS Visual Analytics community, where experts there are more likely to be able to help.

- Mark as New
- Bookmark
- Subscribe
- Mute
- RSS Feed
- Permalink
- Report Inappropriate Content
- Mark as New
- Bookmark
- Subscribe
- Mute
- RSS Feed
- Permalink
- Report Inappropriate Content
Thank you ! I'll move it over there. Appreciate your depth of knowledge and the way you keep an eye on things in here!
- Mark as New
- Bookmark
- Subscribe
- Mute
- RSS Feed
- Permalink
- Report Inappropriate Content
Happy to help...

- Mark as New
- Bookmark
- Subscribe
- Mute
- RSS Feed
- Permalink
- Report Inappropriate Content
I'll answer here, but note there is a separate JMP Community where more JMP experts will see your questions.
Yes, your script is launching Graph Builder 3 times. You need to somehow construct a single script which accounts for the variable number of columns and then run that script. JSL supports that kind of meta-programming (a script that creates another script) using the functions Expr(), Name Expr() and Eval Expr().
Below is an example like what I think you are trying to do.
// a table with lots of columns
dt = Open( "$SAMPLE_DATA/Decathlon.jmp" );

// an expression for the graph's variables
vars = Expr( Variables( X( :Country ), Y( :Score, Side( "Right" ) ) ) );

// an expression for Points elements
points = Expr( Points( X, Jitter( 1 ) ) );

// a loop to programmitically insert variables into those expressions
first col = 4;
last col = 6;
For( i = first col, i <= last col, i++,
  Insert Into( vars, Eval Expr( Y( Expr( Column( dt, i ) ), Position( 1 ) ) ) );
  Insert Into( points, Eval Expr( Y( Expr( i - first col + 2 ) ) ), 1 + i - first col );
);
//Show( vars, points );

// build the Graph Builder expression from those
gb = Eval Expr(
  Graph Builder(
  Show Control Panel( 0 ),
  Expr( Name Expr( vars ) ),
  Elements( Expr( Name Expr( points ) ), Line( X, Y( 1 ) ) )
  )
);
//show( gb );

gb; // execute the expression
.jpg")
Catch up on SAS Innovate 2026
Nearly 200 sessions are now available on demand in the Innovate Hub.
Watch Now →See how to use one filter for multiple data sources by mapping your data from SAS’ Alexandria McCall.

Find more tutorials on the SAS Users YouTube channel.
-
5 replies
-
04-10-2015 04:10 AM
-
6241 views
-
2 likes
-
4 in conversation
-
