- Home
- /
- SAS Viya
- /
- Visual Analytics
- /
- Use the derived data items in charts
- RSS Feed
- Mark Topic as New
- Mark Topic as Read
- Float this Topic for Current User
- Bookmark
- Subscribe
- Mute
- Printer Friendly Page

- Mark as New
- Bookmark
- Subscribe
- Mute
- RSS Feed
- Permalink
- Report Inappropriate Content
Hi!
I want to use some of the various derived data items, like Year to Date Growth or Difference from Previous Parallel Period, in my charts and graphs. However, I need these measures calculated for data that is compiled on a fiscal year basis, not a calendar year basis. Any thoughts or suggestions on the best way to accomplish this in VA?
Thanks.
Paul
Accepted Solutions

- Mark as New
- Bookmark
- Subscribe
- Mute
- RSS Feed
- Permalink
- Report Inappropriate Content
I have used the follwoing expression to build the new fiscal year, this might help you get started
IF ( Month('saleDate'n) BetweenInclusive(1, 6) )
RETURN DateFromMDY(( Month('saleDate'n) + 6 ), DayOfMonth('saleDate'n), ( Year('saleDate'n) + 0 ))
ELSE DateFromMDY(( Month('saleDate'n) - 6 ), DayOfMonth('saleDate'n), ( Year('saleDate'n) + 1 ))
- Mark as New
- Bookmark
- Subscribe
- Mute
- RSS Feed
- Permalink
- Report Inappropriate Content
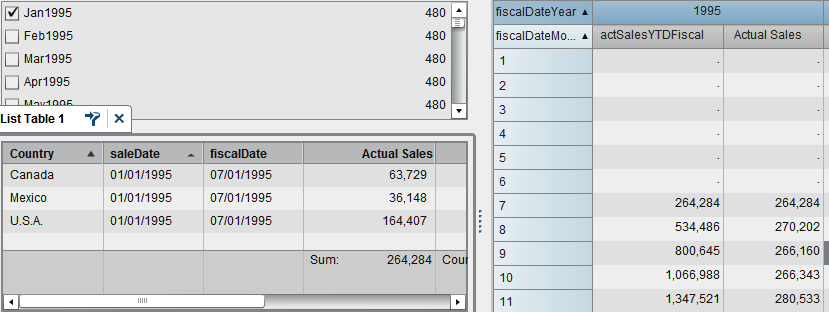
I suggest you build another date column, that has a proper date according to the finance year, for example your finance year begins on the 01jul2014 so you translate this into 01jan2015 and then use this new data item to build your YTD etc values.
You will need to duplicate this new data item to get fiscal year and fiscal month (you can use the month format and display it as a number) to build a report, here is an example:

- Mark as New
- Bookmark
- Subscribe
- Mute
- RSS Feed
- Permalink
- Report Inappropriate Content
Hi, Bruno..
Thanx for u r fostest reply,
I will build new data column, but I have one question, I want it will be automatic every year...in VA
Do u have any suggestions...
Thanks,
Teja surapaneni
- Mark as New
- Bookmark
- Subscribe
- Mute
- RSS Feed
- Permalink
- Report Inappropriate Content
I have used the follwoing expression to build the new fiscal year, this might help you get started
IF ( Month('saleDate'n) BetweenInclusive(1, 6) )
RETURN DateFromMDY(( Month('saleDate'n) + 6 ), DayOfMonth('saleDate'n), ( Year('saleDate'n) + 0 ))
ELSE DateFromMDY(( Month('saleDate'n) - 6 ), DayOfMonth('saleDate'n), ( Year('saleDate'n) + 1 ))
- Mark as New
- Bookmark
- Subscribe
- Mute
- RSS Feed
- Permalink
- Report Inappropriate Content
Can u pls send me screen shots...
- Mark as New
- Bookmark
- Subscribe
- Mute
- RSS Feed
- Permalink
- Report Inappropriate Content
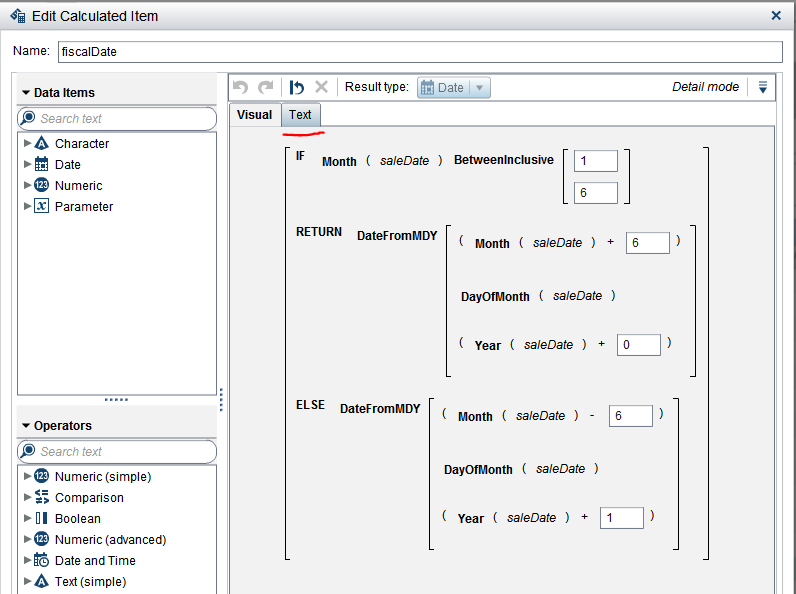
However I think it is a lot easier to just copy/paste the expression in the text area, in picture above marked in red
- Mark as New
- Bookmark
- Subscribe
- Mute
- RSS Feed
- Permalink
- Report Inappropriate Content
Thanx Bruno, for sending us screen shot, let me try, after that I will share my experience vth u, once again thanks...
Thanks,
Teja.
- Mark as New
- Bookmark
- Subscribe
- Mute
- RSS Feed
- Permalink
- Report Inappropriate Content
Please be aware the expression I used only works if the fiscal year starts on 01July. I suggest you add the fiscalDate column to the data that is loaded into the LASR Server.
- Mark as New
- Bookmark
- Subscribe
- Mute
- RSS Feed
- Permalink
- Report Inappropriate Content
Bruno,
Thanks for your help! In reviewing the results after implementing your calculation, I noticed some missing values. The missing values displayed when the new fiscal date did not have a corresponding date to the sales date. For example, August corresponds to February. So, when a sale occurs on Aug 30th or 31st, that corresponding date in February displays as "." since the month of February does not have a 30th or 31st. This situation is true for the months of October and April, December and June, March and September, and May and November.
My thought is another IF or CASE statement needs to be included to account for these discrepancies. If you know of a better solution, please suggest it. Any help is welcomed. Thanks again!!
- Mark as New
- Bookmark
- Subscribe
- Mute
- RSS Feed
- Permalink
- Report Inappropriate Content
I guess the easiest way is just to assume some constant value for the day, since as you pointed out, some days might not exist in the financial month. As suggested earlier, I would create the value for the financial date outside of VA. SAS provides the INTNX function, which allows you do advance a date by some interval, see the example below:
infile cards dlm=",";
input
saleDate : date9.
amount : best12.
;
fiscalDate = intnx("month", saleDate, 6, "B");
format saleDate fiscalDate date9.;
cards;
30aug2014,123
31aug2014,456
;
- Mark as New
- Bookmark
- Subscribe
- Mute
- RSS Feed
- Permalink
- Report Inappropriate Content
Thanks all! I will let you know the results when I try it later.
.jpg")
Catch up on SAS Innovate 2026
Nearly 200 sessions are now available on demand with the SAS Innovate Digital Pass.
Explore Now →See how to use one filter for multiple data sources by mapping your data from SAS’ Alexandria McCall.

Find more tutorials on the SAS Users YouTube channel.
-
10 replies
-
01-22-2015 09:27 AM
-
5146 views
-
6 likes
-
3 in conversation
-
