- Home
- /
- SAS Viya
- /
- Visual Analytics
- /
- Stacked and grouped bar chart
- RSS Feed
- Mark Topic as New
- Mark Topic as Read
- Float this Topic for Current User
- Bookmark
- Subscribe
- Mute
- Printer Friendly Page

- Mark as New
- Bookmark
- Subscribe
- Mute
- RSS Feed
- Permalink
- Report Inappropriate Content
Hi all,
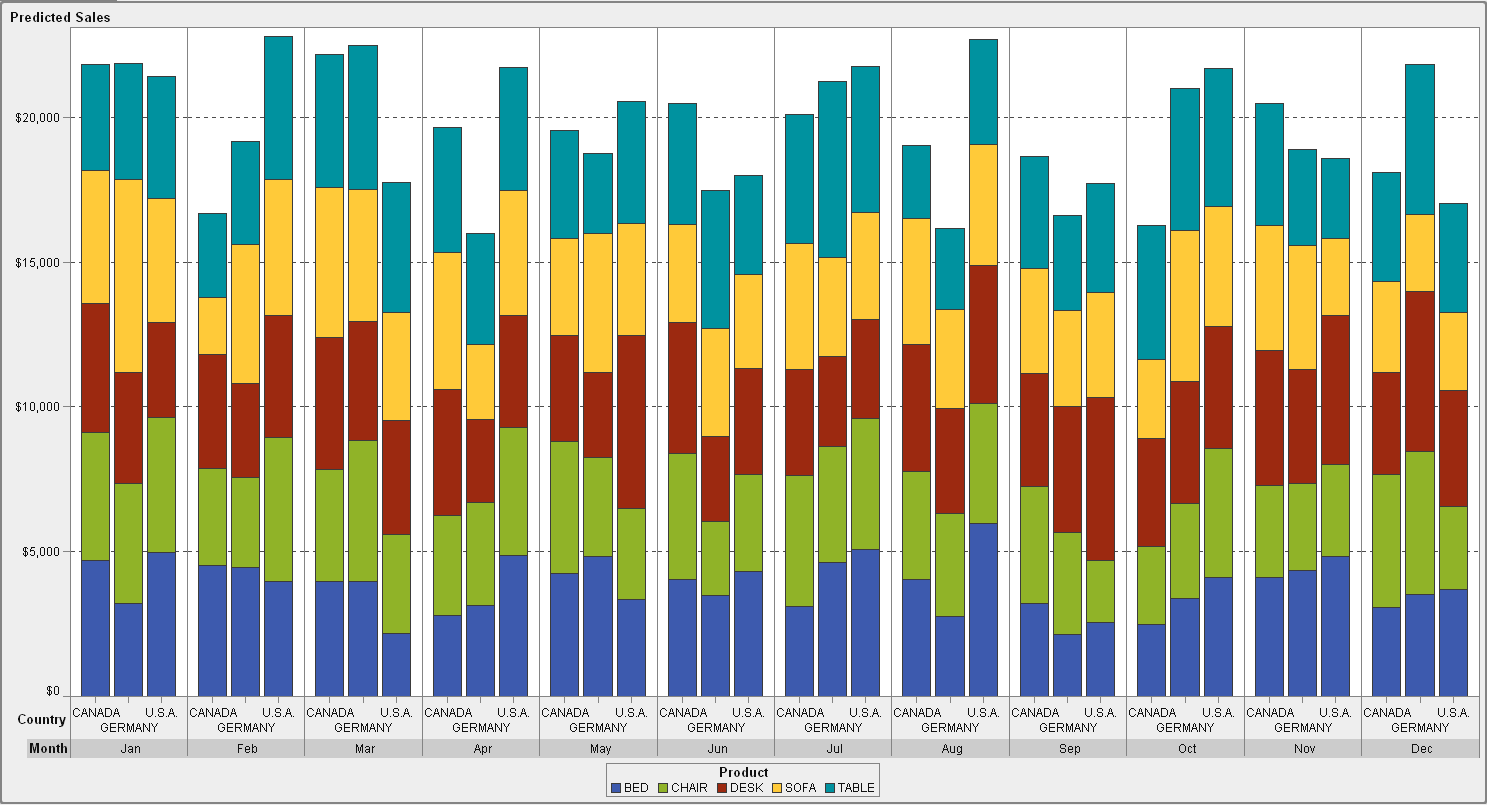
With SAS Base I created in the past a graph that has grouping at the x-axis and is stacked. See printscreen below.
Did anyone create a custom grapfh like this?
Thanks for your reactions,
Michel de Kooter


- Mark as New
- Bookmark
- Subscribe
- Mute
- RSS Feed
- Permalink
- Report Inappropriate Content
Hi Michel
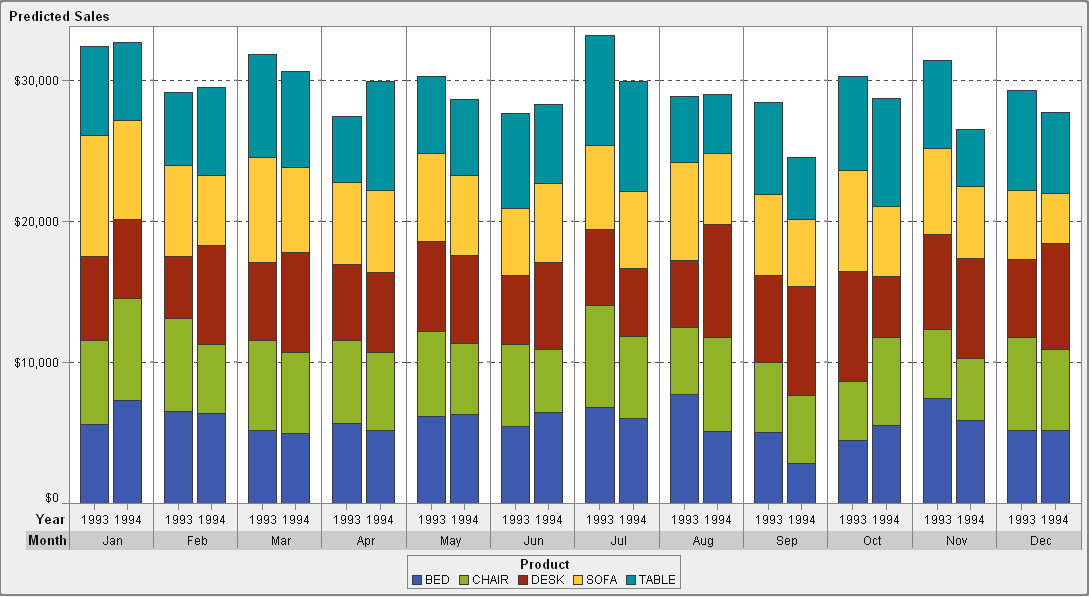
Is your bar stack a stacked group or stacked multi-response? Here is an example I created using the Bar Chart graph object in VA Designer. This object stacks group values. Is this what you are looking for?
Thanks.
Ravi Devarajan
- Mark as New
- Bookmark
- Subscribe
- Mute
- RSS Feed
- Permalink
- Report Inappropriate Content
Hi Ravi,
Thanks for your response. I think this is exactly what I want.
The graph is stacked group. 2 Groups: by month and year, one stack by product type.
Could you sent print screens how you did it?
Michel
- Mark as New
- Bookmark
- Subscribe
- Mute
- RSS Feed
- Permalink
- Report Inappropriate Content
Hi Michel
Here are the steps to do what I posted earlier. I am using VA6.4. You could do this with VA6.3 as well.
Please let me know if you need further clarifications.
Thanks
Ravi
Step 1: DND Bar Chart graph object from left side pane in VAD

Step 2: Load your data
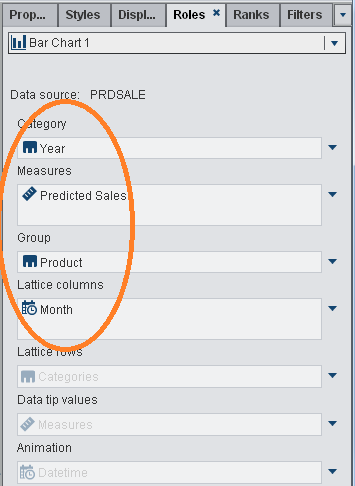
Step 3: In Roles tab on right pane in VAD, assign your appropriate data columns to the graph object roles, as I have done below. In my case, Lattice columns was a Date item but it could be a Category item as well.
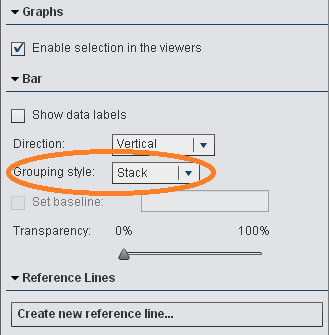
Step 4: In Properties tab on right pane, set Grouping style to Stack under Bar Properties
This should give you the desired result.
- Mark as New
- Bookmark
- Subscribe
- Mute
- RSS Feed
- Permalink
- Report Inappropriate Content
Hi Ravi,
This works perfect. I didn't get the lattice working properly, but not it works very good.
Thanks for your assistence.
Michel
- Mark as New
- Bookmark
- Subscribe
- Mute
- RSS Feed
- Permalink
- Report Inappropriate Content
Good to hear Michel, and good luck with your project.
Ravi

- Mark as New
- Bookmark
- Subscribe
- Mute
- RSS Feed
- Permalink
- Report Inappropriate Content
Hi all,
Sorry to return to this old topic. I have a question can be a little bit credulous.
I created a stacked histogram and i need to display label for each group on the histogram. This works fine with a cluster grouping style but not with a stacked one.
Did Did anyone has an idea on how do this ?
Thank you.
Bayex

- Mark as New
- Bookmark
- Subscribe
- Mute
- RSS Feed
- Permalink
- Report Inappropriate Content

- Mark as New
- Bookmark
- Subscribe
- Mute
- RSS Feed
- Permalink
- Report Inappropriate Content
Hello @sz247
Yes you can. You can find it from the right panel > Options > Bar > Grouping style >

Best regards,
Petri

- Mark as New
- Bookmark
- Subscribe
- Mute
- RSS Feed
- Permalink
- Report Inappropriate Content
Is there any way to generate this kind of graph with a Proc template in SAS? Please share your ideas.
Thank you,
Raj.

- Mark as New
- Bookmark
- Subscribe
- Mute
- RSS Feed
- Permalink
- Report Inappropriate Content
A question about Proc Template should be posted to the SAS Programming Community.
-------------------------------------------------------------------------
Four tips to remember when you contact SAS Technical Support
Tricks for SAS Visual Analytics Report Builders
SAS Visual Analytics Learning Center
.jpg")
Catch up on SAS Innovate 2026
Nearly 200 sessions are now available on demand in the Innovate Hub.
Watch Now →See how to use one filter for multiple data sources by mapping your data from SAS’ Alexandria McCall.

Find more tutorials on the SAS Users YouTube channel.
-
10 replies
-
05-23-2014 05:32 AM
-
19098 views
-
2 likes
-
7 in conversation
-
