- Home
- /
- SAS Viya
- /
- Visual Analytics
- /
- Re: Self Join on Time Series SAS Visual Analytics
- RSS Feed
- Mark Topic as New
- Mark Topic as Read
- Float this Topic for Current User
- Bookmark
- Subscribe
- Mute
- Printer Friendly Page
- Mark as New
- Bookmark
- Subscribe
- Mute
- RSS Feed
- Permalink
- Report Inappropriate Content
I’m looking to see if Visual Analytics has a feature that can make what I was manually structuring on the interface side using some sort of time linking like parallel periods or the like without creating a new table via self joins prior to the interface layer.
I have an enrollment table that has one record per student per semester. I’d like to use the enrollment table to display if students are still enrolled in any given semester 30 semesters out. The display needs to be the number of students enrolled in the base enrollment semester, and the number of students still enrolled in the other semester and were enrolled in the base semester.
I created a table by hand with the fields (From_semeseter, To_semester, enrolled) then displayed the information in a tabular format. The structure was created by joining the enrollment table self-joining the enrollment table 30 times. The problem is that creating the structure maxes out my tiny system resources.
proc sql;
	/*enrollment table*/
	create table enrollment (
		Student char(10),
		Term_num int
	);
	insert into enrollment (student, term_num) values ('Bob', 1);
	insert into enrollment (student, term_num) values ('Bob', 2);
	insert into enrollment (student, term_num) values ('Bob', 4);

	/*self joined enrollment*/
	create table self_joined_enrollment (
		Student char(10),
		From_Semester int,
		To_Semester int,
		enrolled int
	);

	insert into self_joined_enrollment(student, From_semester, to_Semester, enrolled) values ('Bob', 1, 1, 1);
	insert into self_joined_enrollment(student, From_semester, to_Semester, enrolled) values ('Bob', 1, 2, 1);
	insert into self_joined_enrollment(student, From_semester, to_Semester, enrolled) values ('Bob', 1, 3, 0);
	insert into self_joined_enrollment(student, From_semester, to_Semester, enrolled) values ('Bob', 1, 4, 1);

	insert into self_joined_enrollment(student, From_semester, to_Semester, enrolled) values ('Bob', 2, 2, 1);
	insert into self_joined_enrollment(student, From_semester, to_Semester, enrolled) values ('Bob', 2, 2, 1);
	insert into self_joined_enrollment(student, From_semester, to_Semester, enrolled) values ('Bob', 2, 4, 1);

	insert into self_joined_enrollment(student, From_semester, to_Semester, enrolled) values ('Bob', 3, 3, 0);
	insert into self_joined_enrollment(student, From_semester, to_Semester, enrolled) values ('Bob', 3, 4, 0);

	insert into self_joined_enrollment(student, From_semester, to_Semester, enrolled) values ('Bob', 4, 4, 1);

	/*example of data displayed*/
	select From_Semester, to_semester, sum(enrolled) as Students_Still_Enrolled
	from self_joined_enrollment
	where From_Semester =1 and to_semester=2;
quit;
- Mark as New
- Bookmark
- Subscribe
- Mute
- RSS Feed
- Permalink
- Report Inappropriate Content
@DavidPhillips2 are you looking to do 'Difference from previous parallel period' or 'Percent difference from previous parallel period' calculations on your report data within SAS Visual Analytics? If so, something like this? -> SAS Help Center: Working with Quick Calculations in a Report If so, it assumes you have a date or date/time data item for the calculation and that same date or date/time data item is also displaying within the visual where you want this calculation to display (e.g. Crosstab, List table, Bar chart, etc.).
- Mark as New
- Bookmark
- Subscribe
- Mute
- RSS Feed
- Permalink
- Report Inappropriate Content
I looked over the documentation for these features. I'm not seeing a feature that will allow the type of report I included with the example.
In time one a student is enrolled in time X then display 1.
A trickier one is if the student graduated before time X display 1.
- Mark as New
- Bookmark
- Subscribe
- Mute
- RSS Feed
- Permalink
- Report Inappropriate Content
@DavidPhillips2 forgive me that I'm not following you now. Any chance you can attach some sample input and expected output table mock-up? You did type previously: "I'm not seeing a feature that will allow the type of report I included with the example." I see SQL code but not a report example. Regardless, if you need a more immediate answer at this point, feel free to call into our SAS Tech Support @ 919-677-8008.
- Mark as New
- Bookmark
- Subscribe
- Mute
- RSS Feed
- Permalink
- Report Inappropriate Content
Ted, the SQL code produces all of the following that you asked for.
- Mark as New
- Bookmark
- Subscribe
- Mute
- RSS Feed
- Permalink
- Report Inappropriate Content
@DavidPhillips2 my apologies I think because you first used the term "parallel periods" I jumped to wrong conclusions and was expecting date formatted data items. Since SAS VA has a specific feature called "parallel periods" (among related calculations) when it comes to date formatted data items and thus the doc link I sent above (and subsequent sample data/report request).
- Mark as New
- Bookmark
- Subscribe
- Mute
- RSS Feed
- Permalink
- Report Inappropriate Content
Hi @DavidPhillips2, I think this should help solve it. Let's add some additional students to the data just so we can confirm that this is working as expected.
data students;
    input student$ term_num;
    datalines;
Bob	1
Bob	2
Bob	4
Dan	2
Dan	3
Dan	4
Jon	3
Jon	4
;
run;
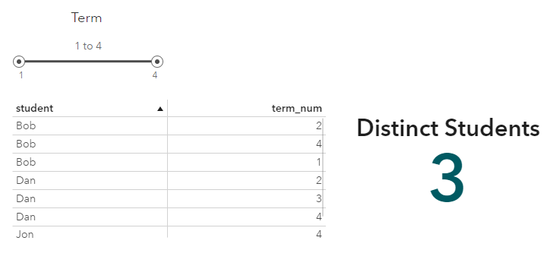
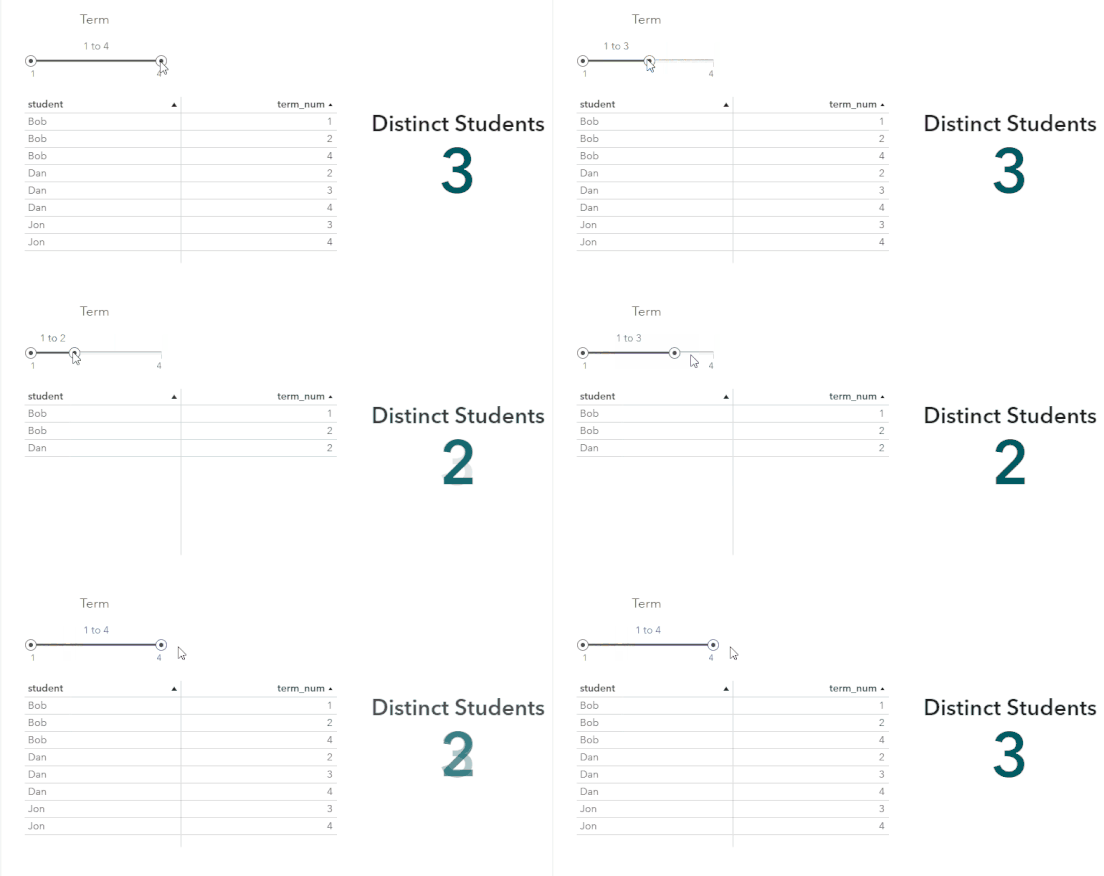
What it sounds like we want to do is count the number of distinct students between terms. We can do this using a distinct calculation and parameters. For example:
To do this:
- Right-click student and select New Calculation. Use Distinct Count.
- Drag in a table, a key value, and a slider as a page control
- Add student and term_num to the table. Enable "Detail Data" on the table.
- Add the distinct count of student to the key value
- Add term_num to the slider
And that's it! It should dynamically count between the terms.
Check out my GitHub for SAS tips and tricks
Read my blog for cool SAS and open source data science projects
- Mark as New
- Bookmark
- Subscribe
- Mute
- RSS Feed
- Permalink
- Report Inappropriate Content
This solution might work. I need to add some If logic to use this method for a particular business use case. If the student graduated before the semester, do not count them as enrolled for any record of that student after the From semester A student can have one or many degrees; I think I can include redundancy with degrees and still use this logic. I'll look into this methodology tomorrow; hopefully, there will not be a complication with mixed aggregation levels in the if / distinct logic.
- Mark as New
- Bookmark
- Subscribe
- Mute
- RSS Feed
- Permalink
- Report Inappropriate Content
- Mark as New
- Bookmark
- Subscribe
- Mute
- RSS Feed
- Permalink
- Report Inappropriate Content
The methodology of using distinct with two parameters is very practical. I'm sure I'll use it for something else. Unfortunately, I need to know if a student was enrolled from 1 to a large number of semesters from their starting semester whether they have an enrollment record or not so it looks like I'm stuck creating a cross-joined structure, which is a small version of big data.
April 27 – 30 | Gaylord Texan | Grapevine, Texas
Registration is open
Walk in ready to learn. Walk out ready to deliver. This is the data and AI conference you can't afford to miss.
Register now and save with the early bird rate—just $795!
See how to use one filter for multiple data sources by mapping your data from SAS’ Alexandria McCall.
Find more tutorials on the SAS Users YouTube channel.


