- Home
- /
- SAS Viya
- /
- Visual Analytics
- /
- Re: SAS VA - time series plot question
- RSS Feed
- Mark Topic as New
- Mark Topic as Read
- Float this Topic for Current User
- Bookmark
- Subscribe
- Mute
- Printer Friendly Page

- Mark as New
- Bookmark
- Subscribe
- Mute
- RSS Feed
- Permalink
- Report Inappropriate Content
Hello all,
My dataset looks like the following:
| Date | ValueYear | ValueYear-1 |
|---|---|---|
| 01/01/2014 | 0 | 20 |
| 02/01/2014 | 0 | 10 |
| 03/01/2014 | 0 | 15 |
| 01/01/2015 | 14 | 0 |
| 02/01/2015 | 15 | 0 |
| 03/01/2015 | 16 | 0 |
I have calculated in VA the cumulative period of ValueYear and ValueYear-1.
I want to plot this so I can easily compare this year, with the previous year.
Any suggestions?
Filip

- Mark as New
- Bookmark
- Subscribe
- Mute
- RSS Feed
- Permalink
- Report Inappropriate Content
Filip,
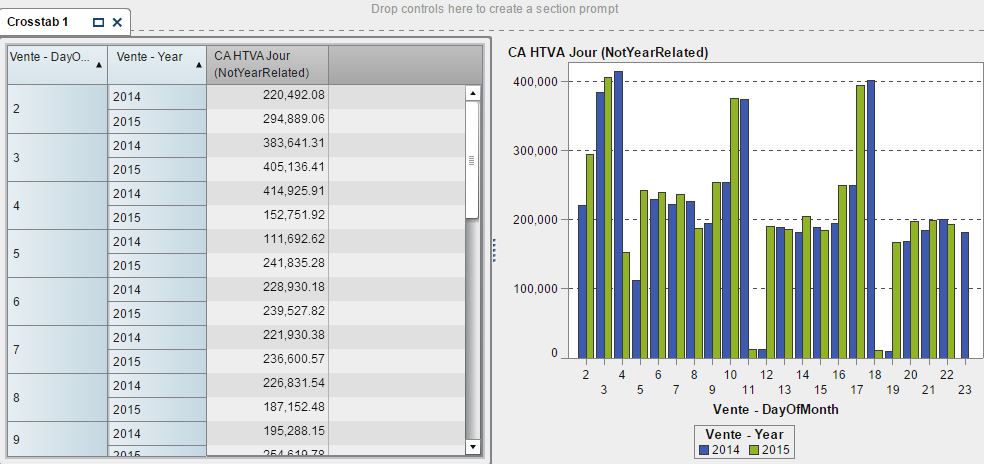
If you derive the year out of the dates (new calculated item), you can use this field in a bar-graph to stick the two bar together and compare them.
While changing the date format to monthday, you can create your barlabels with these in relation to the created year field.
If needed, I could prepare a sample for you.
Greetings
- Mark as New
- Bookmark
- Subscribe
- Mute
- RSS Feed
- Permalink
- Report Inappropriate Content
Hello Peter,
I'm trying to create the dateformat to monthday. Can I still have it like a datevariable?
I tried to calculate it and put in a character format but then the sorting is not correct anymore.
If you want, you can show me a sample.
Thanks,
Filip
Here is a sample of my data: 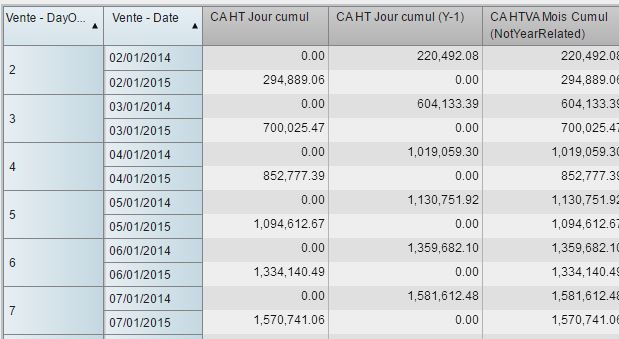
- Mark as New
- Bookmark
- Subscribe
- Mute
- RSS Feed
- Permalink
- Report Inappropriate Content
Hello Filip,
You are right that this is not possible in one crosstable. (Date format can not be changed in the way you/I want).
I am not shure about version 7 (I get it next month) but I Know there is a development request making the YTD not only depending on dates)
Lets see if it is in a next release.
For now, only option would be to put two tables besides each other if your dates are running equal in VA. ( As far as I can see now.)
Other option is to prefix the data....
greetings
- Mark as New
- Bookmark
- Subscribe
- Mute
- RSS Feed
- Permalink
- Report Inappropriate Content
Hi Peter, thanks for your time
I got something, but i'ts not cumulative yet...
The NotYearRelated is calculated with an If statement: if CA (Y) <> 0 then return CA(Y) else return CA(Y-1)
Thanks again
- Mark as New
- Bookmark
- Subscribe
- Mute
- RSS Feed
- Permalink
- Report Inappropriate Content
Hi Filip,
nice work. I fixed it ones in the database :smileyblush: to get this result. (be aware it concerns financial period and not calendar periods)
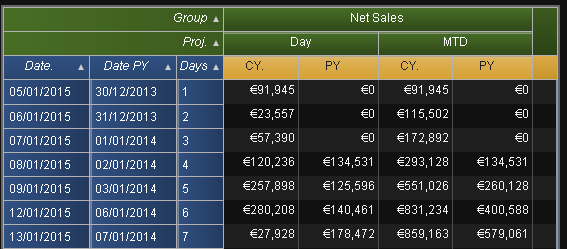
Hopefully this will be availeble in the next release.
Greetings and succes
.jpg")
Catch up on SAS Innovate 2026
Nearly 200 sessions are now available on demand in the Innovate Hub.
Watch Now →See how to use one filter for multiple data sources by mapping your data from SAS’ Alexandria McCall.

Find more tutorials on the SAS Users YouTube channel.
-
5 replies
-
01-21-2015 08:48 AM
-
3638 views
-
0 likes
-
2 in conversation
-
