- Home
- /
- SAS Viya
- /
- Visual Analytics
- /
- Plot relative risk and it's (95% CI) paneled grid plots
- RSS Feed
- Mark Topic as New
- Mark Topic as Read
- Float this Topic for Current User
- Bookmark
- Subscribe
- Mute
- Printer Friendly Page
- Mark as New
- Bookmark
- Subscribe
- Mute
- RSS Feed
- Permalink
- Report Inappropriate Content
Hi Folks:
I'm posting the question in Visual Analytics as well since i didn't know how to move my post from Programming to her.
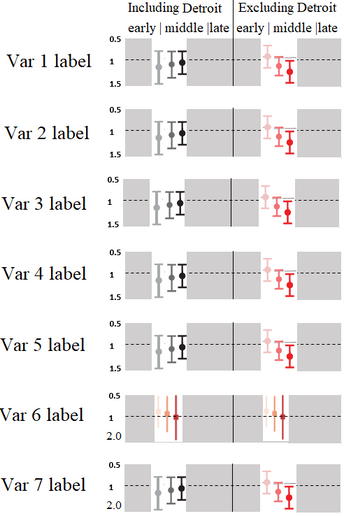
I'm trying to visualize the RR (95% CI) stratified by three time periods (early, middle and late) comparing between two subsets of data including Detroit vs excluding Detroit.
Please note that last two variable in the plot are on the different scale because of their wider range.
Is it possible to create a plot as shown below using the data I posted in the code snippet?
Help creating this plots is greatly appreciated.
Variable definitions.
There are seven variables Var 1- Var 7 to group the plot by rows.
Variable 'phases' define the columns: early | middle | late in the plot head.
Detroit (yes) defines 'Including Detroit'
Detroit (no) defines 'Excluding Detroit' in the side to side columns in the plot.
Values of lower and upper limits of 95% CI defines the length of each strike and relative risk=rr defines the middle bubble.
rr = Relative risk
rr_l= Lower limit of 95% CI
rr_u= Upper limit of 95% CI
data ci;
input Phases $ Detroit $ Variables $ rr	rr_l rr_u p_value;
cards;
early	yes	Var1	1.0524	1.00966	1.09695	0.0158
early	yes	Var2	0.84551	0.79209	0.90254	0.0001
early	yes	Var3	1.0543	1.03979	1.06902	0.0001
early	yes	Var4	0.86697	0.81497	0.9223	0.0001
early	yes	Var5	1.00921	0.98268	1.03646	0.5
early	yes	Var6	0.70181	0.58942	0.83561	0.0001
early	yes	Var7	1.30173	1.03098	1.64358	0.0267
middle	yes	Var1	1.04559	1.01123	1.08111	0.0089
middle	yes	Var2	0.85085	0.80236	0.90227	0.0001
middle	yes	Var3	1.047	1.02776	1.0666	0.0001
middle	yes	Var4	0.92206	0.8788	0.96745	0.0009
middle	yes	Var5	0.99772	0.97841	1.01741	0.8189
middle	yes	Var6	0.97695	0.84688	1.12701	0.7491
middle	yes	Var7	0.98328	0.85264	1.13394	0.8167
late	yes	Var1	1.04109	1.0112	1.07187	0.0067
late	yes	Var2	0.97512	0.93336	1.01875	0.2593
late	yes	Var3	1.00412	0.9892	1.01926	0.5906
late	yes	Var4	0.99671	0.95982	1.03503	0.8642
late	yes	Var5	0.98736	0.97207	1.00289	0.1102
late	yes	Var6	1.06743	0.93955	1.2127	0.3162
late	yes	Var7	0.81891	0.73103	0.91736	0.0006
early	no	Var1	0.99983	0.97043	1.03011	0.991
early	no	Var2	0.96015	0.90744	1.01592	0.158
early	no	Var3	1.03307	1.01981	1.0465	0.0001
early	no	Var4	0.90236	0.86039	0.94637	0.0001
early	no	Var5	0.9896	0.97165	1.00789	0.2633
early	no	Var6	1.09426	0.90321	1.32571	0.3575
early	no	Var7	1.05676	0.89367	1.24961	0.5186
middle	no	Var1	1.02193	0.99727	1.04721	0.0818
middle	no	Var2	0.93691	0.89514	0.98062	0.0051
middle	no	Var3	1.01948	1.00417	1.03503	0.0125
middle	no	Var4	0.94738	0.91323	0.9828	0.0039
middle	no	Var5	0.99374	0.98005	1.00763	0.3751
middle	no	Var6	1.21477	1.06634	1.38385	0.0034
middle	no	Var7	0.89446	0.80586	0.9928	0.0361
late	no	Var1	1.03753	1.00869	1.06718	0.0104
late	no	Var2	0.99744	0.95469	1.04211	0.9089
late	no	Var3	0.99716	0.98166	1.0129	0.7216
late	no	Var4	1.00295	0.96614	1.04116	0.8775
late	no	Var5	0.98597	0.97142	1.00075	0.0627
late	no	Var6	1.13068	0.9913	1.28964	0.0673
late	no	Var7	0.79133	0.7083	0.8841	0.0001
;
Thanks for your help.
Best wishes,
Cruise
- Mark as New
- Bookmark
- Subscribe
- Mute
- RSS Feed
- Permalink
- Report Inappropriate Content
Please describe which variables correspond to which elements of the plots. Especially the Including/excluding.
Some may be obvious to you but not to others.
This makes something close
proc sort data=ci;
   by variables detroit;
run;

proc sgpanel data=ci;
   panelby variables detroit/ columns=2;
   highlow x=phases high=rr_u  low=rr_l;
   scatter x=phases y=rr;
   rowaxis display=(nolabel);
run;
- Mark as New
- Bookmark
- Subscribe
- Mute
- RSS Feed
- Permalink
- Report Inappropriate Content
Thanks for the pointer. I edited in the original box to define variables in relation to the plot.

The 2025 SAS Hackathon has begun!
It's finally time to hack! Remember to visit the SAS Hacker's Hub regularly for news and updates.
See how to use one filter for multiple data sources by mapping your data from SAS’ Alexandria McCall.
Find more tutorials on the SAS Users YouTube channel.


